11. Aligning People with Managing Production Flow (Ryoma Shiratsuchi)
/0 Comments/in Book - theory-on-practice, Latest, Wiki Leadership - Managing People - Change Management Ryoma Shiratsuchi /by jelenafedurko
Ryoma Shiratsuchi
Ryoma Shiratsuchi is the Co-President of Juntos Consulting Inc. and a Founding Member of TOCPA – TOC Practitioners Alliance. Ryoma has over 10 years of TOC experience as practitioner, trainer and consultant. He has worked with >15 companies implementing MTO, MTA and CCPM, and has taught Operations Management and Project Management at Education & Research Center of Manufacturing, Kyushu University.
Abstract
In this article I want to share my experience with a SDBR (Simplified Drum-Buffer-Rope) implementation in a small manufacturer of quartz glass products in Japan. The company produces oxyhydrogen (a mixture of hydrogen and oxygen gases), hyburners, quartz heaters, optical fiber components and chemical tanks. One of the biggest challenges in the implementation was to establish the systematic mechanism that would allow parts of the system help each other to be aligned with the global objective – ever improving production flow, while ensuring respect for individual initiative.
SDBR is the TOC solution for the Make-to-Order (MTO) production environment. It has a simple mechanism to prevent over-production. This mechanism called “Rope”, is enabled by not allowing too early release of Work Orders (WOs). This reduces the amount of open WOs on the shop floor, and encourages production managers to focus on what they should do at that point in time. Many case studies show SDBR implementations bring immediate and significant improvement to the companies by increasing both reliability and responsiveness of the production system.
Every TOC logistical solution has its own execution control mechanism – the Buffer Management (BM). TOC looks for simple and practical solutions to problems. BM represents the uniqueness of TOC in terms of simplicity and practicality. BM has several features in it, such as clear priority, early warning and feedback mechanism. These features are used not only for daily management but also for process improvement. SDBR combined with BM provides a clear priority system based on TIME. Priority to WOs is given through BM, and determined by a three color priority system – Red, Yellow and Green. TOC suggests that production managers should monitor and manage Red WOs so that they can take early corrective actions when needed, while workers are expected to work on the jobs according to the status of the WO’s color: yellow has preference over green. The strength of BM is that it provides a bridge between global objectives and local activities. It creates a foundation to connect the organization, the function and individuals with harmony.
Background of the company
ASAHI SEMICON is a small (approximately 40 employees) manufacturer of quartz glass products for use in laboratories. The company, founded in 1986, is one of the group companies (ASAHI Group) who, together, have approximately 500 employees. ASAHI Seisakusho, one of the group companies, who produces specialized glassware and processing equipment, and is managed by the same CEO as ASAHI SEMICON, had been suffering from a significant amount of overtime work. Due to this heavy workload, the production managers did not have time or capacity to invest their managerial efforts for the future of the company. We suggested implementing a MTO solution into ASAHI Seisakusho’s plant as their first TOC implementation project, and received the assignment . We started the SDBR implementation at ASAHI Seisakusho in April 2010. The result was 86% reduction in overtime coupled with improving Due Date Performance (DDP). After the result was confirmed, the CEO decided to implement SDBR into ASAHI SEMICON as well, and again asked for our help.
The production of ASAHI SEMICON is in an almost pure MTO environment. The type of the manufacturing flow is basically an “I” plant. The production processes include cutting, manual fire processing, kilning, and testing.
The assignment was for four months of consulting work, from January to April 2011, with a once-a-week meeting with two managers of the core team, the Production Director and the Finance Manager who worked with us since the SDBR implementation at ASAHI Seisakusho.
Buy-in
Before starting the implementation at ASAHI SEMICON, in order to design the solution and transfer relevant knowledge to key people, I conducted a two-day Knowledge Development Workshop in December 2010 for six people, including the Production Director and supervisors. I started with an introduction of TOC Basics, and went on to present the problem analysis for the MTO environment by following the structure of the U-shape [1] – the comprehensive thinking model to provide the platform for capturing knowledge and developing solutions. I showed the group the list of typical Un-Desirable Effects (UDEs) of a production company, and asked which UDE they had in reality. The following ones and their implications in their environment were acknowledged:
- Often resources are not available when needed;
- Raw materials are not always available when needed;
- Too much expediting;
- Too much overtime;
- Too often there is a need for an urgent delivery.
It became apparent that “Too much overtime” was the biggest issue for the company. In fact, so much work was assigned to several people with a particular skill, that it caused an imbalanced load within the production department and created an atmosphere of mistrust among the production people.
I presented a brief analysis of the identified UDEs by developing UDE Clouds and introduced the standard core problem (Generic Cloud) of the MTO environment. After some discussion and modifications of the Cloud wording, all participants agreed that this was definitely their core problem. We could move on to the next step – the introduction of SDBR as the MTO solution. Prior to explaining the solution, I used the Job Shop Game [2] for them to capture the “Rope” concept. Every participant had been impressed by the results achieved only by choking the release. Nevertheless, they raised their reservations to its application in their reality. The reservations were expressed as questions, obstacles and potential negative side effects, NBRs (Negative Branch Reservation). It was a good indicator that the participants started to examine the adequacy of SDBR as the solution for them. We recorded all the reservations on a whiteboard, and closed the session of the first day.
The next day began by me presenting a brief overview of the SDBR solution, moving on to the Knowledge Development session with Current Reality Study (CRS) per each element of the solution – an Injection, in the TOC terminology. I introduced the first three of the 8 standard MTO Injections [1]:
Injection 1: Mindset; Delivery performances (DDP and lead time) are established as the prime measurements for the production area.
Injection 2: Production Buffer (PB) is set to be challenging but achievable, with Production Work Orders (WO) released accordingly.
Injection 3: Open Work Orders (WO) are prioritized according to the buffer status of their corresponding Customer Order – through the use of Buffer Management (BM) Buffer Management for recovery actions is in place
A few days after the workshop, I had a meeting with the Production Director. He said to me, “Many thanks for your workshop. Every participant agreed upon the problem, and got interested in the suggested solution – TOC and SDBR. However, for now, I am not sure whether the expected result that TOC can bring us is big enough for us to justify our effort over several months.” I smiled and said, “That’s why I came here today. I would like to help you to have a clear picture of why TOC is needed in your own environment. What are the point that you are unclear about?” He took a moment to think and answered, “I understood that our production flow can be improved by using TOC. However, I have an impression that TOC will bring only limited benefits to our environment. Our current DDP is already very high – over 95%. Unfortunately I do not have enough knowledge to explain to our people why improving flow is so important for us.”
It was clear that we had to make a bridge between improving flow and the tangible benefits that they would gain. So I and asked him, “What is your #1 headache?” He replied immediately, “Overtime” “Anything else?” “Customers changing the due dates. Often there is a need to push the Due Date forward to satisfy the customer’s changed requirement.” “Can you get some premium margin for urgent delivery in this case?” “It depends on the situation; sometimes we can. By the way, talking about customer’s requests, my strongest headache is delay in the materials supplied by the customer. We promise the customer on the Due Date which is 5 days from the agreed date when we are supposed to receive the materials from the customer. However, too often those supplied materials are not available on the promised arrival date. In spite of that the customer compels us to deliver the products on the originally promised Due Date.”
In effect, the Production Director was speaking about business pressures and needs that required improvements in operations. I explained that delivery performance includes two aspects, Reliability and Responsiveness. Reliability is the ability to meet one’s promise, measured by On Time Delivery performance against the originally committed Due Dates. Responsiveness is the ability to respond adequately to the customer’s demand, including advantage in Quoted Lead Time (QLT) and Flexibility to the changing needs of the market. They had achieved Reliability through their strenuous effort, and this was good. However, in the meantime, the current way of managing did not have any features for preventing and/or reducing disruptions on the shop floor, such as re-planning of the production schedule due to changing due dates and/or a lack of availability of the supplied materials. This endangered their responsiveness and the employee’s quality of life (significant overtime).
I suggested that he should think about SDBR as a mechanism for reducing disruptions in the flow, and estimate the possible impact not only from the worker’s side but also from management attention’s point of view. During the Knowledge Development session, I estimated their current average production lead time to be over 20 days, based on the calculation of the current WIP level. Therefore, I asked, “Currently, you have average WIP of over 20 days in production. If we use the Production Buffer, say, 12 days, how will it impact the shop floor?” He considered it for a while and said, “The expected impact is definitely big. The supervisors currently have to do a lot of things for too many open WOs. If we implement Material Release Control, the situation on the shop floor must change dramatically. Mmm…”
We constructed a logical relationship between improving flow and the benefits the plant would get, and reached the following conclusion by the Production Director: “Actually, there is enough value for ASAHI SEMICON to implement SDBR to improve flow. SDBR provides a simple and practical mechanism for reducing disruptions on the shop floor through limiting open WOs and establishes a common priority system and focused exception management. It will provide TIME to the production managers. That would definitely make our production better!” We achieved an adequate consensus.
Aligning Operational Measurements with Business Needs
I started the consulting assignment on the second week of January 2011. Through the conversation with the Production Director in the previous month, I had found the connection between their business needs and operational improvements, and summarized as follows:
Business Needs:
- Improve the possibility to respond with short LT
- Improve the possibility to respond to change of delivery conditions
- Improve the work-life balance of the employees
Operational Improvement Target:
- Primary target: Achieved perfect DDP coupled with increased flexibility
- For management – DDP and T$D
- For Gemba (shop floor workers) – DDP, except for delayed orders due to the late arrival of supplied materials from the customer
- Target to be measured by tracking the # of completed COs per month
- Secondary target: Reduced production lead time and controlled operating expenses
- Record statistics of the actual production lead time
- Overtime hours
“Gemba” has a special meaning in Japan. It originally means a work area. But, when we use this term in a managerial perspective, it means people on the shop floor. Especially in a small company, it is a common situation that shop floor workers have an informal but strong power of influence on managing production, as some of them are skilled craftsmen and have been working for many years.
As DDP is the prime measurement in MTO environment, all the production people, not only managers but also shop floor workers, should be aligned with this measurement. However, we have to keep in mind that measurements should be consistent with the area of responsibility. As said above, Gemba has strong influence on daily management. If the management introduce a measurement of the production performance by measuring the failures that shop floor people have no control over, such a measurement will not be accepted by people. In the case of material delay, shop floor workers have neither responsibility, nor authority to control the availability of materials, as the materials are supplied by customers. Therefore, we decided to have two types of DDP report– DDP reports for managers and for Gemba. In DDP reports for shop floor workers, the delayed orders due to the late arrival of supplied materials by customers are not counted as delay.
The management team agreed that we set the above measurements as an implementation target. I showed the detailed implementation plan to them, and got an agreement to the timeline of the implementation.
Establishing the right mindset – MTO Injection 1
On the afternoon of the same day, we moved on to the first task of the implementation plan. This was to implement the mechanics/procedures for recording the performances of DDP and lead time according to MTO Injection 1. I checked the relationship between customer order (CO) and production work orders (WOs) in their environment, and found that the CO was for one type of product, and the product was produced within one WO. With that we could integrate the CO File and WO File into one Excel file, named “Buffer Management (BM) File.” We determined the structure of the file, and the procedure for collecting the relevant data. Most of the data elements, such as CO ID, date of entry, and Product Description could be introduced automatically from the database of customer orders by using the company IT system. However, a few data elements, such as Production Buffer and actual completion date of WO, needed to be introduced manually. This file was used for producing the release schedule and updating the color status for each WO.
At the same time, we needed to define clearly “when the CO is completed”. So far, production people felt that they finished their job as long as they handed over the products to testing. I asked the core team, “What is the responsibility of your production?” The Production Director said, “To deliver QUALITY products on time.” I kept on asking, “Does the current criteria of the completion of CO really ensure consistency with your responsibility? “No. We should change it”, he answered with a smile.
Implementing Release Control – MTO Injection 2
According to the product line, the production department has three mini-groups: Standard, Burner and Special Group. To begin with, we chose Special Group for the experiment of Release Control according to MTO Injection 2. The mechanics of Release Control are similar to the basic material release by any MRP system. The planned release date is calculated by deducting the Production Buffer (PB) from the Due Date of Customer Order (CO). Production uses printed Work Order (WO) documentations. However, in the plant, production scheduling was done manually. As there was no MRP/ERP system in the company, we needed to come up with a practical idea of how to do that systematically without software support. For that, we had to prepare two things: (1) setting the initial size of PB based on estimation and (2) developing the technical procedure for the new way of releasing WOs to the shop floor.
The PB is the prescribed elapse time that is given for each CO. The PB is divided into three equal parts (zones). The first part is colored by Green, the second by yellow, and the last third by Red. The size of the Red zone should ensure the minimum production time, the back-to-back touch time without queue or wait times. The PB is three times as long as the Red zone. Therefore, in order to get the initial size of PB, it is better to have an indication of the Red zone through estimating the touch time.
In Special Group, the products were classified into five product families. The touch time per product family was estimated based on the typical batch size. Per product family, I simply multiplied the touch time by three, and asked the core team. “Is this number really challenging?” If I got the answer of yes, then I asked again, “Is it really achievable?” Based on these questions, we made some practical adjustments to the size of PB, and got good enough numbers, the initial PBs of 8-14 days per product family. Compared to the actual production lead time of over 20 days calculated based on the WIP level, agreeing on the PB of between 8 to 14 days presented a significant reduction in lead time. However, before developing a new procedure for the trial of releasing WOs, I felt it would be practical to present and explain the planned implementation process as presented in Figure 1 [3]:
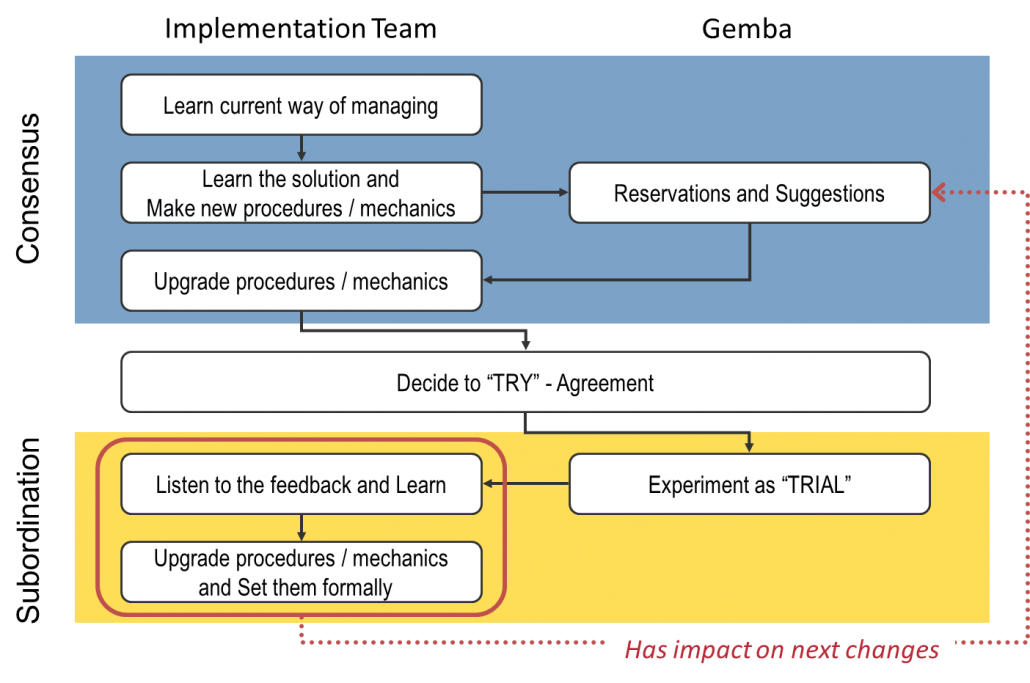
Figure 1: The process of implementing change
Why ‘Trial”? People may not have their intuition about the new environment. Or, even though someone sees negative side effects of implementing the new mechanics/procedure, they may think it is better to say nothing, if logical concerns cannot be verbalized. The “Trial” secures the voice of production people. It also contributes to lowering the hurdle to challenge something new.
Next day, the Production Director explained the new procedure to the leader of Special Group, and got an agreement to try it. From the third week of January, we started the trial of Release Control. The following week we had a meeting and collected the feedback of the experiment from the production people, in order to upgrade the procedure. Through the feedback, we realized that the process for checking availability of raw materials should be included in the Release Control procedure, as per MTO Injection 5.
Based on the experiment of the new procedure and through upgrading it, we made a roll-out plan to expand Release Control to the other two groups. One more thing to be realized, that we had to consider before the roll-out, was for handling Make-to-Stock (MTS) orders. In fact, these groups do have a few WOs issued based on a forecast, less than 10% of the total WOs. After the discussion, we decided to treat these WOs in the same manner as MTO for a while – using a time buffer method.
As a result of having experience of Release Control and the upgraded fully thought out procedure, there was no confusion during the roll-out. Over the next 2-3 weeks, the total amount of open WOs was significantly reduced.
Implementing Four Colors Priority System – MTO Injection 3
The first week of February, we moved on to the next step – implementing a color priority system according to MTO Injection 3. Until then, the scope of change was limited to the area of Production Director and a few supervisors, as we had been only dealing with Release Control. Now, we started to expand the implementation to the level of the shop floor people. The desired behavior had been defined by the clear guideline to assign the WOs to the resources according to the color status of their corresponding CO. The job priority was defined as: first Black, then Red, then Yellow, and Green.
We discussed the mechanism for physically attaching the color code to the WOs, and decided to use a colored clip on the WO documentation and a display board for each group. The WO documentations with a colored clip were put on the display board so that everyone could see which WO was currently being processed by whom, and its upcoming color status.

Figure 2: A yellow WO – the WO documentation is marked with a colored clip
We also developed a procedure for daily updating the “BM File”, and appointed the supervisors as people in charge of changing the clips showing the color status on the WO documentations. At the same time, we finalized the procedure for assigning jobs based on color status. If shop floor people had several WOs having the same color, the second guideline was “earlier Due Date first”. The procedure also included instructions for dealing with non-adherence to the color priority.
The following week, the Production Director had a special meeting, and communicated the priority system to all the workers. Immediately after the meeting, the color clips were put on all the open WO documentations. As of the next day, the color system started without any major confusion, and was immediately established.
Implementing Daily Exception Management by tracking Red orders – MTO Injection 4
From the second week of February, we started setting Buffer Management (BM) meetings in order to establish the mechanism of Daily Exception Management. Even though the people had been getting accustomed to the TOC way, this was a real challenge for us. The core essence of BM meetings versus conventional daily meetings is to judge and manage the recovery actions systematically in line with the global objective, rather than improvising corrective actions that used to be perceived to be the right actions to take but without a clear connection to the global objective.
For the sake of reinforcing the importance of daily BM meetings, I conducted the Knowledge Development session again with the core team – to investigate the current reality. Generally speaking, the greater the craftsman spirit in the workplace, the more likely workers prefer to deal with problems themselves. Through the session we. used the “Cause and Effect” approach, and revealed the same symptom in their environment: the escalation to the management was often delayed. As a result, every time the Production Director recognized the problem, it was already a crisis.,Too much of his time was consumed by resolving such crises.
We had to solve two issues related to the above symptom. One was how to get distortion-free information about the work progress from the workers. The workers might conceal the real situation and give distorted information to the management, if they thought that giving negative progress reports was bad for them. The other was how to prompt recovery actions systematically while ensuring workers’ motivation.
Getting distortion-free information about the work progress
In order to develop the mechanism for recording reasons for Black and Red WOs, we had to overcome the first issue. We analyzed why the workers might have an impression that giving negative progress reports was bad for them. The root cause of having this impression was the perception about their role and responsibility. They believed they fulfilled the responsibility of their job only when they completed the order with their own hands”.
Therefore, we decided to set the following new conditions and behaviors:
- Reporting is a part of their important job. While good reporting makes good recovery actions, poor reporting makes poor recovery actions.
- The simple and clear mechanics/procedure for reporting are in place.
- The impact/result from the taken recovery action should be monitored on a daily basis and shared within the department.
After that, in the daily meetings the working file of Black/Red WOs was updated properly and Red WOs in a high-risk of delay were identified and tracked. It allowed the production management to capture the relevant information in a timely way. Also, production members began to help each other according to the color status.
That was a good change. However, the Production Director was not completely satisfied with it. Why? Because it was only within a group, not across groups. As a matter of fact, there was still an imbalance of the load level from the whole department point of view. While one group constantly had many Red WOs, other groups had excess capacity. The process for balancing flow among the groups needed to be installed. There was a hidden but large opportunity for ever-improving flow.
Prompting recovery actions systematically while ensuring workers’ motivation
To address the second issue – how to systematically prompt recovery actions while ensuring workers’ motivation – we did a further investigation. We needed to find the answer to “What situation made the workers eager to help others?” During the shop floor visit, I found three Red WOs on the display-board. The progress track for them was recorded on the board. “These are problematic orders. It’s like a public flogging” the Production Director told me.
“Then people will feel uncomfortable helping these orders” I said. “Hmm. Well, it seems that we found the answer…”
We organized our findings and developed the following lessons:
- People want to help each other. However, the current system may have some blockages for people to behave in a forthright manner. Therefore, we should first remove such reasons for people not to wanting to help others. Thereafter, we can create the reasons to wanting to help.
- For the former, we should change the definition of the orders that are raised in BM meetings; from “problematic orders” to just “monitored orders”.
- For the latter, we should record “Who helps” and “How much will be recovered by the help” to strongly encourage the contribution of the people.
Results
We achieved the following operational results within four months:
- DDP improvement coupled with increase in the number of completed COs (See Figure 3)
- Production Lead Time reduced from 21.1 days to 6.4 days (See Figure 4)
- Overtime reduced by 37%
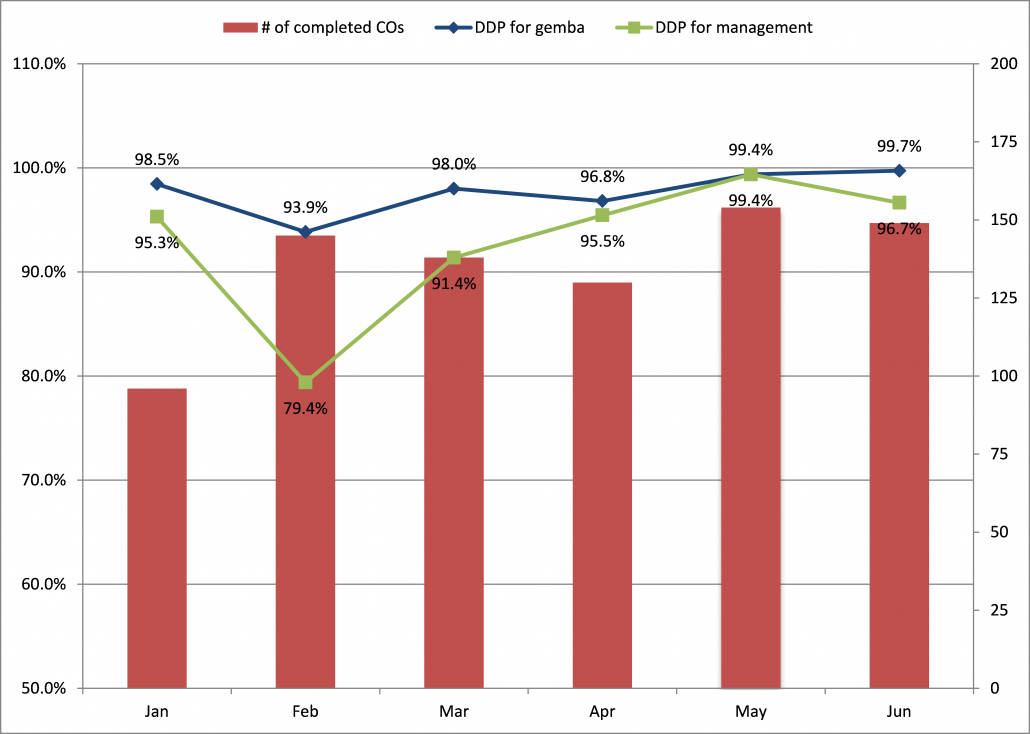
Figure 3: DDP and the number of completed COs
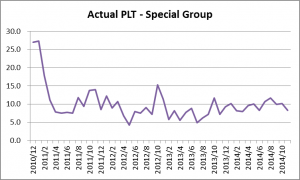
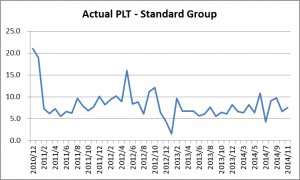
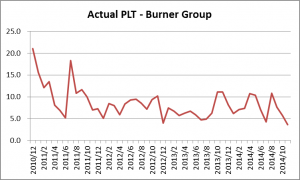
Figure 4: The statistics of the actual Production Lead Time (PLT) per Group
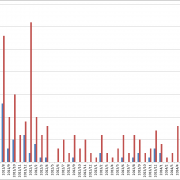
The new system with SDBR provided continuous stability and robustness to the production flow. Figure 5 shows number of delayed orders per month. The blue bar chart represents delayed orders excluding delays due to late arrivals of supplied materials from customers. Red bar chart represents delayed orders regardless of the cause of delay.
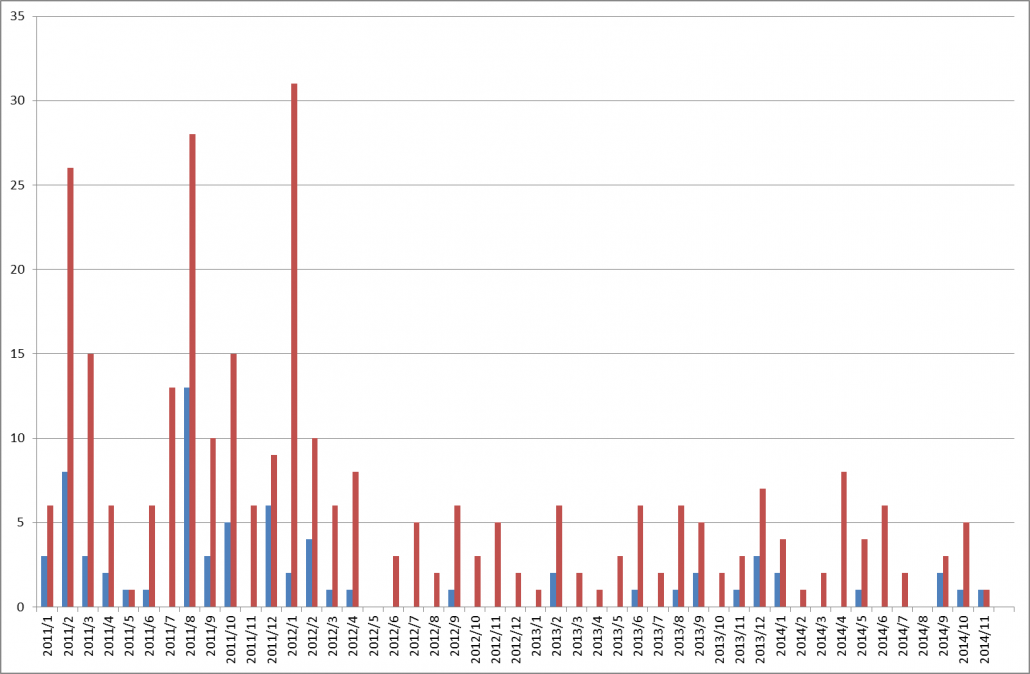
Figure 5: The number of delayed orders
Conclusion and lessons learned
SDBR provided an immediate improvement in Reliability and Responsiveness to the company. Through the implementation, the process of developing and upgrading the mechanics/procedures made people’s roles and responsibilities much clearer. As a result, people focused on their own contribution for managing and improving flow.
Installing the color priority system is nothing more than starting synchronization. To ensure better synchronization, removing the blocking factors against balancing flow is required. This is a real challenge.
References
- Oded Cohen, Ever Improve: A Guide to Managing Production the TOC Way, TOC Strategic Solutions, 2010
- Goldratt Schools, Project Management the TOC Way, Chinese Goldratt Alliance, 2009
- Goldratt Schools, TOC for Production Management, TOC Strategic Solutions, 2010
All materials available on the TOCPA site are the intellectual property of their authors and cannot be reproduced in any other media and used for any purposes without the prior permission in writing of the authors.
