6. TOC in Remanufacturing or Chasing Muda (John Darlington)
A Case Study in TOC and Lean Enterprise Application
This chapter belongs to a collection of vintage stories that are worth telling as they are still relevant for today as they were twenty and thirty years ago. The author brings here his experience of combining TOC, ST Point software (version of OPT) and Lean. The article covers experience of five years (1994-1998).
 John Darlington
John Darlington is a management consultant specialising in TOC & Lean applications applying the principles across the entire enterprise, from design to delivery.
John worked for AlliedSignal Turbochargers from 1986 – 1999. During this time, he held a variety of roles including Financial Director, IT Manager and Plant Manager. John is qualified in TOC, Lean, Six Sigma and Kaizen. John led the systematic introduction of Improvement methodologies across many sites with particular emphasis on practical application to improve bottom line performance.
I learnt about TOC first and came across Lean later; I am happy about that piece of serendipity.
Background
The business is in the automotive industry and we offer remanufactured and non-current production turbochargers and parts to Original Equipment Manufacturers (OEM) and Independent Aftermarket (IAM) customers.
Remanufacturing, as it is more commonly known helps minimise waste by giving products extended life cycles and uses only a fraction of the energy and resources associated with creating new products.
It is worth explaining at this point some of the characteristics of Remanufacturing for those who have not come across it before.
Profitability
Old units as yet unprocessed awaiting remanufacture are called”old core”.
Remanufactured units, in our case turbochargers, generally speaking become a market requirement after a few years of service when warranty periods have expired and when the age of the vehicle means that the owner is perhaps looking for a less costly alternative to buying a new replacement unit.
One way or another remanufactured unit are a cheaper alternative to new units.
This difference can be achieved in a number of ways including sell price discount, payment for the returned “old core”, or some sort of credit scheme. But the effect is the same; the remanufacturer does not get as much sell price for the remanufactured unit as they do for a new one.
This being the case the incentive to enter the business is to collect the “old core” cheaply enough and to engage in the remanufacture process economically enough with good quality so that the sell price gap is closed by more favourable material costs.
In our instance most of the “old core” was returned at a nominal cost, and once accepted on their return it signalled that we would promise to sell a similar unit to the customer in the future at a reduced sell price.
So the basic profit equation was determined by the amount we could successfully salvage out of the “old core” and the timeliness and cost of the remanufacture process.
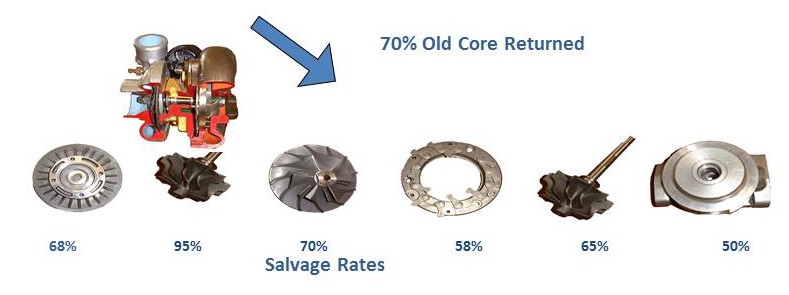
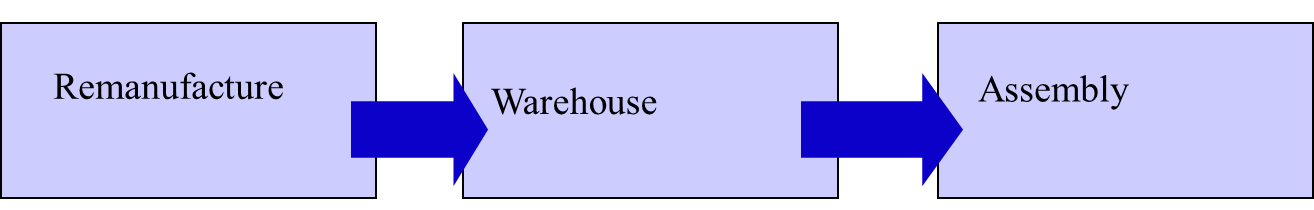
The Process: Figure 1
The “old core” returned is inspected on receipt for identification but has to be disassembled to component parts to judge if it is suitable for the remanufacture process.
Most scrap from “old core” occurs just after disassembly
Following disassembly the surviving components are washed to degrease them and then shot blasted. This is the next highest point of scrap material as deformities, too small to detect when the products are dirty, are revealed when clean.
After cleaning the components go their separate ways for processing.
Apart from a grinding operation on a rotating sub assembly the remanufacture of the turbocharger components was not so difficult technically.
Demand and Planning
The logistics are relatively complex in remanufacturing. The sources of that complexity are: –
• Promising to maintain supply for maybe 20 years after current production status.
• Some customers send in old core “A” but asks for remanufactured unit “B” in exchange or perhaps they have no “old core” at all. In this instance they may have to pay a premium price.
• Despite that premium there is still the issue of trying to source new material for what could be a very old model.
• The sheer volume of part numbers as products tend to be innovated or superseded with cheaper or better quality component materials.
• There can be multiple bills of materials because of alternatives.
• “Old core” may not be available on time.
• Component salvage rates are unpredictable in the short term, as each turbocharger will have experienced different levels of maintenance when in service. See Figure 1.
Early Days
In early 1994 we understood that remanufactured parts were theoretically about one third of the cost of new components. Theoretically because only sum we had any confidence in for comparative purposes was that the total cost of running remanufacturing operations was cheaper than the purchase price for the components we managed to salvage but would have had to have bought new if it were not for successful remanufacturing.
Obviously this “sum” was highly volatile in the short term; for instance during a week if a particular set of turbochargers had experienced a “hard life” then our salvage rates deteriorated and the expensive new components would have to be sourced as alternatives. And in this instance we would still have the operating expense of remanufacture.
Our conclusion was that we could only judge the impact of Remanufacture in the longer term and that individual product margin analysis was flawed because there were too many variables in the mix of old and new components.
So the only way to achieve the profitability of the whole was to ensure a lot of good remanufactured components were contained within the remanufactured whole turbo.
Unfortunately at the time in 1993 and early 1994 remanufactured turbochargers contained predominantly new material and the impact of that are evident from our overall performance which was weakening.
By way of explanation, the volume of assemblies was up by some 20% in 1994 over 1993 which was good but the fact was we were singularly poor at remanufacturing and this resulted in our using too many new and more expensive components in the builds.
And our operating expenses increased. Result; misery
It should be noted from an accounting point of view that no remanufactured components were given any standard cost until they had successfully come through the process. The transaction of inventory valuation and cost recovery was made as the remanufactured component was located in the warehouse store.
This was an important point for what we found in 1994 was that short term profit targets drove poor behaviour through remanufacturing rather than attention to customer value and that flow.
The only target was to recover costs which led to an enormous amount of aluminium components being released for remanufacture whether they were required or not as they enjoyed a 90% plus salvage rate and you could be pretty certain they would survive the process.
Components moved in batches dictated by large containers or “skips” and the inclination was to batch further to reduce set up times.
The MRP system was able to hold alternative component information and allow access to a material planner who had no material available of the primary part number in the bill of materials. However the material planner had to take an active step to allocate the alternative material; another non-value adding transaction and another delay of information.
Further the MRP system was hampering assembly by its inability to split or overlap order quantities to get material flowing.
The People
The people were not the problem. Quite the reverse in fact as without their effort things could have been a lot worse.
However as elsewhere in the Plant the operators and supervisors of remanufacturing were subject to quite a traditional organisation structure.
The remanufacturing part of the business had only been added in 1992. Prior to this it was conducted at a French facility. To accommodate remanufacturing an additional unit of space was leased on the end of the current factory.
However remanufacturing remained segregated physically by a dividing wall and mentally because it was so different to the more usual activities performed in the plant before the 1992 change.
There were approximately 48000 part numbers and which it appeared to me the material planners knew “off by heart”. They used this information informally to adjust assembly schedules and make requests on production for priorities.
Conclusion…Double Jeopardy
It was the conclusion of most people that the poor performances in terms of sales, profit and customer service were directly traceable to the start up of remanufacturing.
An inability to synchronise those efforts put added pressure on supply of new material for if remanufactured components were not available when assembly came to build a remanufactured turbo then new material components had to be used.
If those new components had originally been recruited to fulfil a demand for an order for new parts or turbos then the remanufactured shortage exerted a double impact.
TOC Priority and Kaizen Activity
We needed to improve Planning, People, and Processes
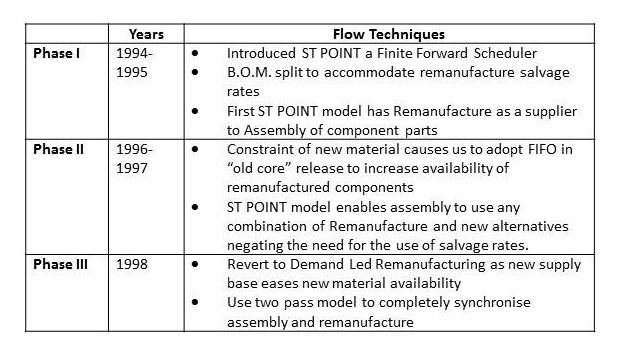
The following three tables note the major changes over the period from mid 1994 to the end of 1998
Planning
The planning issues revolved around three fundamental questions: –
1. What is it that I should order as new material recognising that we will not get 100% of parts salvaged?
2. How much “old core” material should I release into the remanufacturing process?
3. What quantities of good remanufactured parts shall I call for to re assemble the whole thing?
A common solution to the problem of salvage is the idea to split the BOM to reflect the expectation of remanufacture salvage rate and new. (See Figure 1)
Some companies then alter these ratios on a regular basis to reflect changes to process or simply to update to their latest experience of salvage rates.
In some respects we liked this countermeasure as it would ensure that we were ordering the right quantity of new parts as far as anyone could tell and it would be done systematically rather than rely upon a material planner’s good effort.
It would call for a ratio of parts to be processed through remanufacturing which reflected the expectation of salvage and would be synchronised with the arrival of new material.
It offered the expectation that when we came to rebuild it in final assembly a historically accurate call off would be made of new and remanufactured components.
We decided to adopt these practices and set the product engineers off making the necessary adjustments to the BOM whilst a small team implemented a finite scheduler called ST Point as our new logistical tool. By way of explanation ST Point was a derivative of OPT designed primarily by Issachar Pazgal…. All TOC devotees should look that name up :).
It is important to note we did not need ST Point for capacity planning or detailed scheduling in the conventional sense. Our number 1 constraint was how to make the best use of raw materials.
The first model the team built in ST Point was based upon assembly demand and we indicated to the scheduler that demand for remanufactured components could be fulfilled by a supplier called Reman. Clearly this was our own remanufacturing plant which now received a schedule once a week at first.
Unlike the previous system, which simply tried to keep value high for accounting “credits”, we had now established what part numbers were actually required at component level and in what quantities. New material was similarly synchronised to make up the balance of the demand requirement.
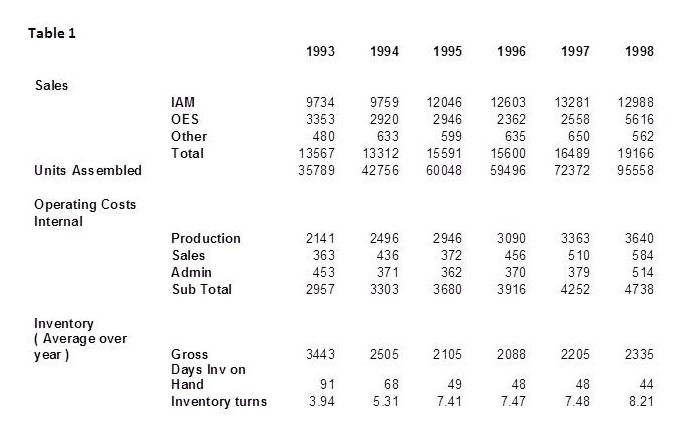
Throughout 1995 ST Point released inventory in a much-improved manner over MRP for both new and remanufactured turbochargers. Our inventories fell substantially as you might expect but once the excessive buffers had been consumed after maybe 6-8 months then we were confronted by us how poor our suppliers were at delivering on time.
The suppliers became the limiting factor for an extended period and caused us to “flatten out” in terms of Performance as can be seen above in terms of Sales Units assembled and Inventory in Table 1 during 1995-1996
Finally we got Group agreement to launch a plan to develop our own supply base for non-core components. This was a long hard process worthy of its own story but suffice to say the Purchasing Manager was an inspiration in terms of hard work and determination.
Realistically we knew that we would not see a significant change in the supply situation until the final quarter of 1996. You can commence resourcing supply of components as quickly as you like but appointing new suppliers takes time
However considering we were often so short of new parts we looked to make better use of the several thousand “old cores” which were awaiting a call off for disassembly. These old turbochargers did not always match the total requirement of demand but did contain many useful parts that we could not obtain easily as new.
Although this appeared on the surface to be condoning over production, possible the worst form of waste, we had to try to increase the usage of remanufactured parts and take the pressure off new recruitment at least until our new suppliers kicked-in. This was achieved by introducing a FIFO method of old core disassembly.
At the same time we utilised ST POINTS ability to handle “chained alternative” material information automatically. This did away with the need to describe and update the salvage rates to the system.
Where the MRP system through the BOM had established a relationship of 70% remanufacture and 30% new and in reality the ratios had come out at 60% remanufacture and 40% new then MRP required a material planner’s intervention.
ST Point established a linked chain of alternative part numbers and having done so would check availability of each one to fulfil an order.
If there was a sufficient quantity of the first part number in the chain it went no further. If there is none or insufficient it went automatically to successive alternatives until the order is satisfied.
Component Chain Turbo Chain
Reman A to Reman B Turbo A to Turbo B
Reman B to Reman Turbo B to Turbo C
Reman C to New B Turbo C to Turbo D
New B to New C
New C to New A
• Order new components driven by ST POINT (100%)
• Re-assemble using any combination of remanufactured and new parts via chains
By 1998 our environment had changed again. Against a backdrop of very high demand for new assemblies, transferred from another part of the group, space became a constraint.
We examined the amount of remanufactured product we were storing in respect of the FIFO policy of disassembly and concluded we could reduce it significantly. In addition the reason for introducing the policy had been to gain time whilst our new supply base was introduced. This was a more mature process by 1998 so we could afford to change.
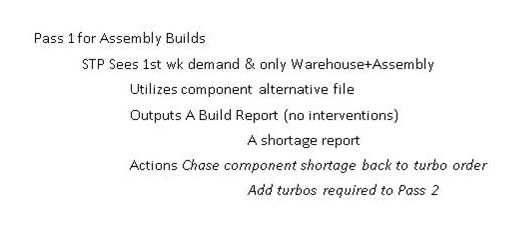
New and good remanufactured parts were stored in our Warehouse awaiting a signal that they were required for assembly. By using a time horizon of just one-week we allowed ST Point to choose parts for assembly.
Using the “chained alternatives” its priorities would be to try finding remanufactured parts but if they were not available use new parts. Sometimes it would find neither remanufactured nor new components and highlight a shortage.
ST Point would then check the turbocharger that was creating the shortage and add that to a second scheduling pass. In the second pass we looked at demand in assembly for the second week but did not allow ST Point to see any components in the Warehouse at all.
In the absence of any components ST Point would pick the “old core” to be disassembled to match the demand for new assemblies.
These had to be completed in week 1 so that when an assembly schedule was to be created for week two, components were then available in the Warehouse.
And so the cycle would continue.
The ST POINT and the “2 x Pass Solution”
People
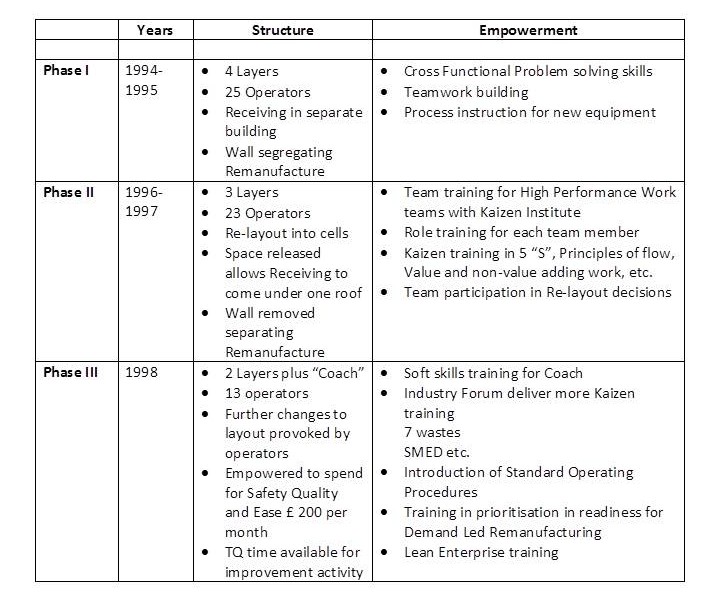
We knew we had a good workforce and in 1994/95 we took active steps by team working activity and TQ problem solving tools to motivate and encourage them to test their solutions.
We examined our processes and where we believed we had a core process we took steps to invest in capital and training to enhance our ability to master it.
The Human Resources Manager developed what is known as High Performance Work Teams. That is we extended the general team working and cross-functional problem solving of our TQ training into specific training for natural work teams.
Together with this we assigned each team member a role. The size of our plant and consequent teams lent itself to this activity so that each member had an active role to play.
To train them in these roles we used the Kaizen Institute in a “train the trainer” exercise in which two local employees learnt the Kaizen teaching to roll it out in the rest of the plant later.
As the objective was to tap into the inherent understanding of the operators and to get closer to their issues, which is where the real value added lies in a factory, we reduced the number of layers between plant manager and operator.
A major test of the success of this training was the re-layout of the Remanufacture area.
Assisted by the Kaizen Institute it became a major participative event and with policies and rules established regarding 5”s”, Visual Management, and HS&E considerations, team representatives fed back to their teams so that they could highlight concerns and have a say in their own cell construction.
The re-layout was such a success we managed to free sufficient space to bring goods receiving into the main plant, reduce the distance travelled by parts by several hundred metres. Also to divest ourselves of another facility we owned some 30 miles away.
By 1998 our environment had changed again and after something of a breakthrough in our logistical planning we reverted to Demand Led Remanufacture from FIFO
Processes
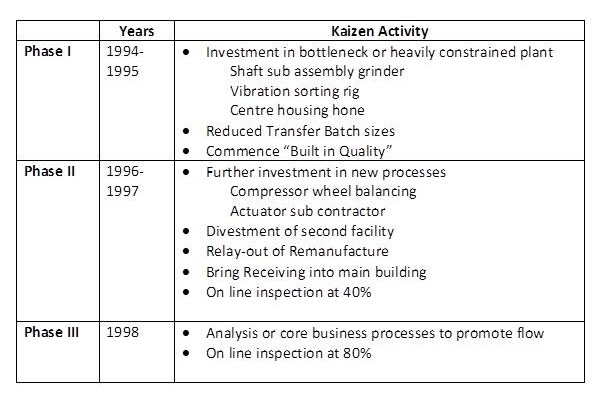
As a key issue in turbocharging is the speed at which the turbo spins, sometimes exceeding180, 000 revolutions per minute, balancing those rotating parts is a key skill.
Thus we looked to bring grinding and balancing sub assembly rotating operations in house and further invest in final assembly balancing capability which we defined as a constraint or occasionally bottleneck resource considering our backlog orders and a heavily constrained resource for normal demand.
Other core processes were analysed and the re layouts already described made the processes more close knit reducing the need for information flow.
Conclusions
Five years is a long period to review in any case study so this conclusion must be abbreviated to the pertinent points.
The main breakthrough events were TOC driven via improved planning. However it would be wrong not to comment on the spirit of the workforce and how their smaller stepped improvement complemented the bigger picture.
The author spent 5 happy years as plant manager or 60 month ends :).
Although I would argue it was successful in terms of profit and Inventory turns, it was less so in relation to customer service.
The down side was that the growth that we enjoyed and which was so helpful in allowing us to reward removal of waste by employment in a more value adding capacity meant we experienced almost constant new component shortages as suppliers struggled to keep up. This translated into delays to customer orders.
Profit, both in absolute terms and as a % of sales, grew tremendously in the years from 1994 to 1997. After this time the transferred business changed sales mix so fundamentally that a comparison is difficult. However total profit has continued to grow.
How?
• ST POINT enabled better synchronisation leading to output increases of over 250% whilst only 16% more operators were introduced.
• Physical floor space reduced by 25%.
• Inventory turns increased more than fourfold.
• Simplification of “spaghetti” production and introduction of “U” shaped cells reduced distance travelled by over 500 metres.
• The same “simplification” of the flow increased the communication between operators making it easier to work by visual means and engaged their imagination and efforts to “flow” material.
• The introduction and pursuit of empowered natural work teams generated more improvement ideas than we could have dreamed possible in 1994.
• In remanufacturing with STPOINT focussing us closer on “true” demand more than double the output was produced by almost half the number of employees compared with the starting position.
Acknowledgements
Oded Cohen
Kate Mackle Kaizen Institute Europe
David Howells Director Renault Institute of Quality Management
David Blacklock Scheduling Technology Group
Harvey Ball and Kendall
All materials available on the TOCPA site are the intellectual property of their authors and cannot be reproduced in any other media and used for any purposes without the prior permission in writing of the authors.
Comments to the article are below the Table of Contents

11. Aligning People with Managing Production Flow (Ryoma Shiratsuchi)

10. Article on Viable Vision (Gerald Kendall)

9. Using Agile Techniques in Critical Chain Project Management (John Muncaster)

8. Building Consensus with Stakeholders (Keita Asaine)

7. Applying manufacturing flow theory to construction management (Stratton, Koskela, AlSehaimi and Koskenvesa)


