10. Article on Viable Vision (Gerald Kendall)


Gerry KendallGerald Kendall, TOC International, US

Gerald Kendall has five published books on TOC reflecting his successes in Project Management, Health Care, Viable Vision and Thinking Processes. He has implemented all elements of TOC with his worldwide clients over the past 22 years.

gerryikendall@cs.com


© Copyright Gerald I. Kendall 2006, 2016 All Rights Reserved

Introduction

When I do an analysis of a company, I am satisfied only when I clearly see how it is possible to bring the company to have, in less than four years, net profit equal to its current total sales.”

This very ambitious goal, verbalized by Dr. Eli Goldratt [1], is so outside the norm of most company achievements, that many excellent managers laugh when they hear this quote. Sadly, many managers believe that anything even close to this level of improvement is impossible to achieve, especially in a large company.

Yet, in the majority of the hundreds of companies examined over the past three years, this belief was proven wrong—to the extent that many of these companies are now implementing their identified Viable Vision! They are succeeding in the pre-identified steps to turn their top line to bottom line within 4 years.

How is it even possible, let alone likely, that your company can achieve such rapid profit growth? The answer is in two facts:

  1. Most companies today compete on factors that do NOT provide a decisive competitive edge.
  2. Most companies today do not have the capabilities to create and sustain a decisive competitive edge.

For example, there are many companies whose salespeople focus on product content (features, quality, customization). Or, within many distributors of commodity products, we find most salespeople focus on aspects such as price, quantity discounts, minimum order quantities, geographic coverage. Some high technology providers see their competitive edge coming from a technical breakthrough.

In all of these companies, these tactics are NOT a decisive competitive edge. They may allow the company to exist and even to flourish for a limited time. However, these points typically do not provide a decisive competitive edge – one that will last for years and sustain a super high rate of growth.

In the Viable Vision approach, a decisive competitive edge implies that your company is meeting a client’s significant need to the extent that no important competitor can. The success is measured in year-after-year of high growth and having more prospects than the company can possibly address, even with internal capacity expanding at a high rate.

Here are a few examples – some of these will be discussed in more detail later in this article:

  1. Reliable Rapid Response (RRR) – In custom manufacturing industries, it is common to find that many companies are extremely unreliable in due date performance. For example, if you are a customer in an industry dominated by unreliable suppliers, who needs a custom product by a certain date, and you will experience significant damage to your business for every day that the product is late, then reliability is one of your significant needs. Even a supplier performing at 80% on time means that you cannot predict when you will get your product. Any promise that supplier makes is useless because it is unpredictable – 20% of the time, the supplier will miss the due date. How can the customer possibly tell whether or not it will be in the next order? A supplier who has proven 99%+ due date performance, and is willing to provide a written, guaranteed due date with significant penalties for every day late, can easily gain a decisive competitive edge. BUT FIRST, the company must be able to achieve the 99% on time delivery AND their salespeople must know how to sell such an incredible offer.
  2. Supply Chain / Distribution – It is very common in many supply chains with stocked products, to find that distributors and retailers have most of their available cash tied up in inventory. Even with such massive investment, a strange thing happens. At the same time that they have excesses of many products in some locations, they experience shortages of the very same products in other locations. Any approach that can dramatically increase the availability of these products across the supply chain, while simultaneously reducing the inventory invested in these same products, can be described as providing a decisive competitive edge. However, it must be sustainable, especially when there are a constant stream of new products and when consumers change their minds frequently on how much and when to buy.
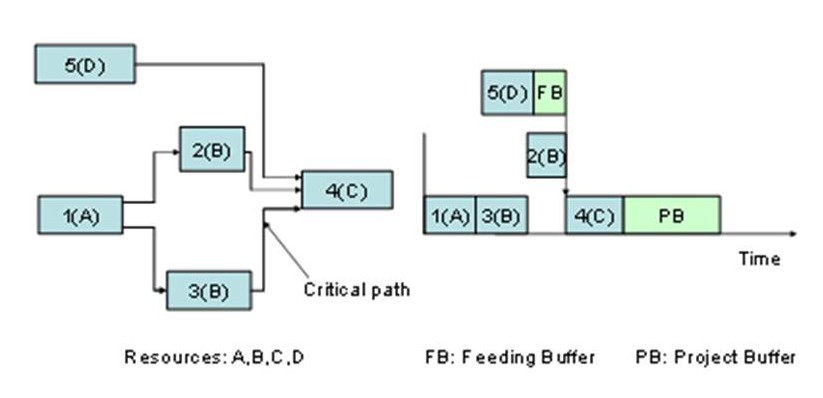
  3. Projects – Some companies undertake major projects either to expand their business, to replace an ailing facility or to meet a government requirement. Examples include implementing new computer systems, building a new plant, opening new retail facilities, constructing buildings, etc. In such major projects, it is common to subcontract large portions of the work to other companies (whom we will call “Project Companies”). In general, the track record of project companies delivering projects on time, on budget and within scope is abysmal. The Standish Group, who repeatedly surveys tens of thousands of projects, quotes statistics of over 70% of projects either late, over budget or out of scope. Project companies can gain a decisive competitive edge by establishing the project management logistics to be able to finish much earlier than your competitors, with a much higher probability of being on time, on budget and within scope. Such logistics begin with an approach called Critical Chain Project Management, but Viable Vision provides other necessary components (such as a structured sales offer) to ensure continued success and increasing margins over the long run.

Viable Vision is unique in its approach, even within companies that are familiar with the Theory of Constraints (TOC) methodology. It is top-down. It is the focus of all top managers for 4 years or until the Viable Vision is achieved, whichever comes first. It begins with a significant, formal buy-in approach, using two forms of buy-in:

  1. The + buy-in: Showing how the pot of gold can be found
  2. The minus minus (–) buy-in: Showing major negative situations and how they can be overcome.

Buy-in usually begins with a healthy skepticism from many members of a senior management team. What makes senior management so skeptical? Their disbelief is usually based on the existence of huge obstacles that block a major improvement. It is possible to turn this skepticism around, but only if you can prove beyond a reasonable doubt that you can overcome these obstacles.

This article:

  • examines these questions by looking at two different approaches to improving a company—the traditional and the Viable Vision approach.
  • spells out the reasons why the traditional approach is popular, but often breeds skepticism and fails to overcome the obstacles.
  • explains how the Viable Vision approach works by showing the series of steps necessary to create a Viable Vision that is enthusiastically supported and executed by the entire top management team.

This is the dynamite needed to permanently break down the silos that are cemented in many of today’s management structures.

Two Ways to Manage – Traditional and Leveraged

Most executives currently deal with a very complex environment—one that is far more complex than it was 20 years ago. The Internet, for one thing, has exponentially increased competition and made business life uniquely challenging.

The common practice today, to manage this complexity, is to break down the organization into manageable parts (usually functional areas and departments), and to hold each part accountable for meeting goals within its silo.  If you have any doubt about this, just look at your own organization chart and related metrics.

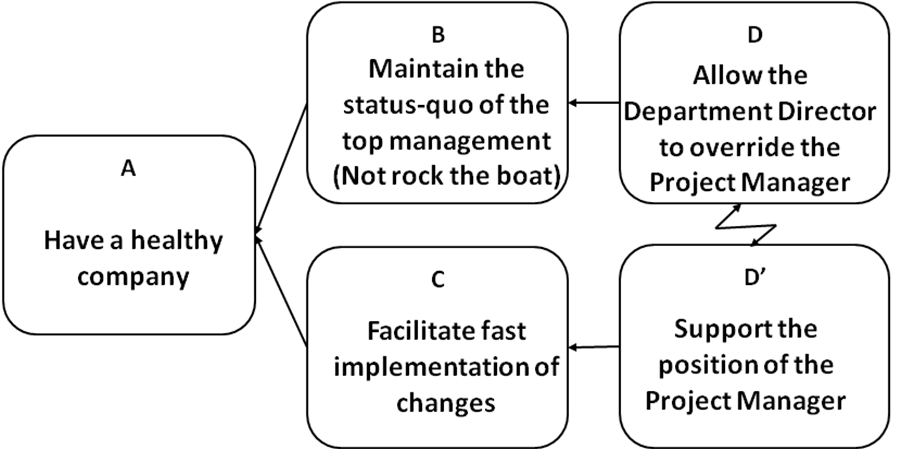
In this mode of management, we see executives spending considerable time to get their silos to cooperate with each other. Individual functional heads interpret what they think is best for their unit and assume it is best for the company as a whole. But often the best we can hope for, in this mode of management, is an attempt to minimize the cross-functional conflicts and damage. Executives become frustrated referees and jugglers, frequently overriding silo metrics in trying to do what makes sense for the organization as a whole.

One typical real-life example is the head of Procurement of a large Bangladesh company who claimed he was saving 70 million Taka (about US$1.3 million) per year by his department’s actions to reduce material costs. His staff spent an arduous year finding reliable and cheaper local suppliers to replace overseas vendors. These same actions were costing US $200,000 per week in lost Throughput, due to manufacturing problems created by substandard materials. The head of manufacturing and the procurement people fought constantly over whether or not the materials were the cause of the problem. The conflicts had become so common that they were just accepted as a fact of life.

We see similar conflicts in most organizations, for example, between Sales and Manufacturing or Sales and Marketing, or between Distributors and Suppliers within a supply chain, between Operations and Delivery personnel—especially in service organizations.

These conflicts are an inherent part of the traditional way of managing complexity. However, there is another way —the Viable Vision approach. This approach also accepts that organizations are a complex beast. To manage the complexity, Viable Vision finds the inherent simplicity (the biggest leverage point) in the midst of the complexity.

This approach assumes that an organization is like a chain. The strength of a chain is determined by its weakest link. Strengthening any link, other than the weakest link, does nothing to strengthen the chain. Therefore, finding the weakest link in the industry (including the Viable Vision company) becomes the leverage point for the organization’s resources. Strengthening it, with a comprehensive, cross-functional strategy and supporting tactics, is the way to ensure exponential growth.

Why the Traditional Approach Fails

With each functional head tasked with and measured on improving their area, they know they must achieve significant change within the quarter and the year to meet their goals. Such change fosters new projects, which each functional head sees as their absolute right to initiate.

Some projects require cross-functional resources. This is where huge conflicts often exist, since these same cross-functional resources (usually in Information Technology, sometimes in engineering or marketing) are in high demand by other functional areas.

The conflicts, however, are not just over resources. For example, if you are the Manufacturing VP, improvement means that you have made your area more efficient. Often, this translates into being able to produce more with the same resources. If you achieve this goal, but Sales is unable to sell your excess capacity, then the pressure is on you to lay off people—something that has many negative ramifications. This can lead to finger-pointing and other ill-feeling in the top management ranks.

There is another major reason why the traditional approach fails. Most companies have a vision, but unfortunately, many visions are not perceived by some key managers or employees as viable. The cross-functional logistics and steps needed to move closer to the vision are not in place. In this situation, each silo feels like it has no choice but to proceed, on its own, to local optima—i.e., to improving within the silo. But without the strongly managed connection (alignment) between silos, many local improvement efforts do not translate into significant bottom line results.

Viable Vision Backbone

Every Viable Vision strategy begins with the same starting assumptions:

  1. For any company to turn top line into bottom line in four years, their gross profit (Throughput) must grow much faster than their operating expenses. Therefore, no Viable Vision is based on cost cutting as a primary strategy.
  2. No major improvement effort is sustainable if the senior management team (or other key resources to the effort) must work incredible hours or under extreme stress for years. Experience shows that after a short time, such resources are easily distracted and tend to lose focus.
  3. There is no need, and indeed it may be harmful, to take high risks. An example of high risks might be capital investment or other actions that endangers the cash flow of the company.

Given these assumptions, the generic Viable Vision strategy has five key elements:

  1. Build a decisive competitive edge
  2. Build the capabilities (sales and marketing) to capitalize on a decisive competitive edge
  3. Ensure there are big enough markets to grow sales at high annual rates, while being selective about the choice of prospects
  4. A road map that allows the company resources to focus without wasting effort and without exhausting themselves or each other
  5. A road map that precludes the need for taking risks that are too great

In each Viable Vision, we must identify a client’s significant need that will provide the opportunity to create a lasting, decisive, competitive edge. To be lasting, the competitive edge must never be based on price or cost. It must be in a form that no existing significant competitor can readily copy. In fact, for Viable Vision, we want the competitors to believe that the Viable Vision company is crazy to make such a ridiculous offer to their customers, and that they (the competitor) would certainly never match such an offer. That is one characteristic that makes the competitive edge “decisive”.

In the following examples, you will find detailed descriptions of two such Viable Visions.

Two Examples of Viable Visions

Example 1 – Reliable Rapid Response

In this example, there are certain conditions that must exist in the market in order for a company to gain a decisive competitive edge. These conditions include relatively long lead times (e.g., typically weeks, not hours or a day or two), poor due date performance by most suppliers (e.g., 80% or less – enough that the client cannot count on any delivery date promised), damages to the client as a result of late delivery (e.g., the client cannot manufacture their product, the client cannot unload a ship, the client cannot complete a building), clients do not have ready alternatives (e.g., if the product is highly customized, the client cannot go to a store and buy it), and the price they are paying for the product is small relative to what they are doing or building (e.g., the product is a $2,000 component of a $500,000 airplane).

It is not necessary for all of these conditions to exist in order for the market to be right. As long as clients suffer damage from supplier unreliability, and the product you are selling is a small part of the total value of the client’s end product or entity, there is a good chance that Reliable Rapid Response will work to achieve a Viable Vision.

With the above existing conditions, a company gains a decisive competitive edge when their prospects know that the company is remarkably reliable. Of course, there is an assumption that all other market-driven parameters (price, quality, lead time, range of offerings, etc.) are about the same as the competition.

A company can have a very high level of confidence in a supplier’s due date performance if the company is willing to back up the promise with a hefty penalty (e.g., 10% per day off the price for every day late – 10 days late and the product is free). Still, there are three main components needed to back up this offer:

  1. The company must build the capability to deliver 99% on time, in spite of variability in the market demand for their products.
  2. Sales must pursue the right prospects, and get better and better at their close ratios.
  3. The company’s internal capacity must be continually monitored and expanded before their sales success creates super long lead times.

Once these components are mastered, the company has met all the necessary conditions to begin offering much shorter lead times for a premium. Premiums can be anywhere from 10% to several hundred percent more than list price, depending on the extent of damage the client suffers from unreliability. For example, a precision machine shop in Colorado regularly gets three times their normal price when they deliver a custom part in 1 week instead of 4 weeks. A Canadian kitchen cabinet maker gets 50% more for the same custom kitchen delivered in 2 weeks rather than 6 weeks.

Every extra dollar goes right to the bottom line. Look at what happens to a company’s profits from this approach:
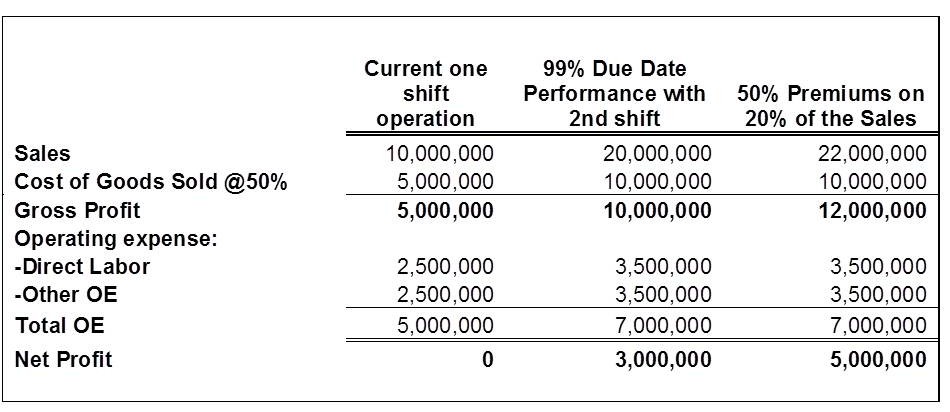
Slide1

Figure 1

In Figure 1, in the first instance, the company is running one shift per day. From that, they are able to generate $10 million per year in sales. With a 50% cost of raw materials, they are left with half that much as Throughput or Gross Profit. Out of the gross profit, they must pay labor and all other operating expenses, leaving them at a break-even operation – zero profit.Figure 1 – Sales and Profit Impact of a Viable Vision

In the next column, we implement the first stage of a Viable Vision. With the implementation of production logistics, a company’s excess capacity is revealed. Experience has shown that there is often much more excess capacity than the company believes. When you take, as a first step, the rule of thumb of cutting production lead times in half, and releasing that much less to the shop floor, the effect is amazing. The shop floor’s excess work in process contracts significantly, and the excess capacity stands out. Therefore, the company is able to implement a full second shift without having to double either their direct labor or other operating expenses. From experience, the figures shown are generous.

That is why the net profit jumps from zero t o$3 million. But we are not finished. As sales becomes better and better, and the internal team is able to maintain protective capacity and grow resources as needed, we move to the last column, where we implement Viable Vision’s rapid response offer to the market. Before doing this, we must make sure that manufacturing can actually build a product in much shorter lead times, without having to expedite it through the plant. This is especially easy in most plants, which have production lead times far in excess of the actual touch times required to build a product.

In this stage, we are able to get premiums for much shorter lead times, as in the examples cited above. So on 20% of sales, or $4 million, we charge a 50% premium, securing another $2 million in revenues without incurring an additional cent in cost. As a result, our net profit for the same work as we did in the middle column, boosts our profit from $3 million to $5 million.

Once again, building the capabilities to take advantage of the reduced lead times implies significant marketing and sales work. The company must better define their target markets as those prospects who most benefit from their reliability offer. They must establish a pipeline of such prospects. The sales process steps must be defined in detail, and tools provided to the sales force to move quickly through those steps. The pipeline must then be monitored and constantly improved to shorten the sales cycle times and increase the success ratio.

Example 2 – Consumer Goods Distribution

Conditions that typify a consumer goods supply chain include low inventory turns, combined with frequent and numerous stock availability problems. Companies in the supply chain invest most of their available cash in inventory, but still suffer shortages. Suppliers typically make and stock products according to a sales forecast. Forecasts, especially involving end consumer behavior, are notoriously bad.

Distributors and retailers typically use a variation of a min/max inventory system to determine when to reorder stock. Both of these practices (supplying to a forecast and min/max system) contribute to major distortions in replenishment of goods throughout the supply chain. Resulting damage in lost sales, markdowns, obsolescence and lost customers are common.

With these practices in consumer goods markets, it is commonplace to see inventory turns of less than 6 per year, and turns of 2-3 per year are not unusual. TOC logistics changes the mode of replenishment from “push” to “pull”. This is done by linking all parts of the supply chain together to replenish what was actually consumed. Target inventories are adjusted automatically for any changes in consumer demand, or for known seasonality or other known aberrations.

Forecasts are still used at a consolidated level, for major manufacturing planning. However, actual consumption data is affecting the plant finished goods buffers and orders to the shop floor. The entire TOC replenishment system, from manufacturer to end consumer, is built to respond quickly to any changes in consumer demand. This puts the right inventory in the right place at the right time.

Today, many companies try to increase their turns by reducing inventory.  The inventory turns can increase, but this can easily mask the bad way the results were achieved. If major markdowns were required to reduce the inventory or worse, major amounts of inventory were written off the ledger books, the turns number could improve, but the company still has poor cash flow and poor availability.

A decisive competitive edge in consumer goods distribution implies that margins are higher than with traditional approaches, turns are much higher, inventory levels are lower and availability across the supply chain has significantly improved.

But there is another common metric used by retailers with consumer goods products – Sales or gross profit per square meter/foot of shelf space. In TOC Consumer Goods Distribution, we call this Throughput per Shelf, or TPS for short. A supplier who has implemented the full replenishment solution can now move to the next stage of increasing their client’s TPS. One approach to do this is to prevent slow-moving products from staying on a given store’s shelf for too long. If the supplier has many more SKUs than they have actual products stocked in a given store, then they can easily substitute one set of SKUs for another.

In retail shops where slow movers are quickly removed and constantly replace with other items, consumers are encouraged to come back to the shop often to see what’s new. A retail chain can also check which products are selling well in comparable other regions or locations, and choose those items to substitute for the slow movers in another location.

When Viable Vision supplier trains their sales force correctly, they are able to sell business deals to clients, on the basis either of inventory turns or TPS, or first inventory turns moving to TPS as they get to know their clients better. Also, looking at the numbers, the supplier who increases TPS by 25% can demand some of that back in higher margins, and both parties will make a fortune. For an example, see figure 2 below.

Slide2

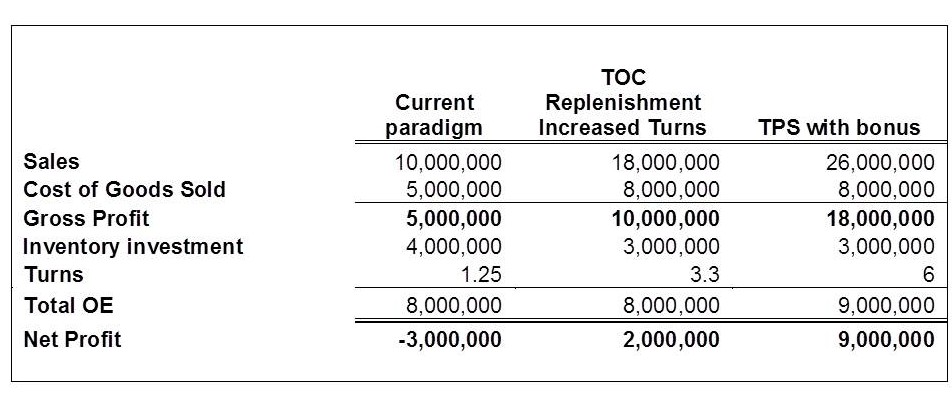
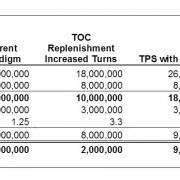
Figure 2 – TOC Replenishment and TPS Impact

In Figure 2, the current paradigm has the company generating sales of $10,000,000. With poor availability, the company will suffer from markdowns and obsolescence. Even though they have very lucrative average margins from suppliers (70% plus from overseas), they average 50% because of frequent markdowns. After paying all expenses, they are losing $3 million per year.

In the next column, we implement TOC replenishment solution. The company’s inventory goes down, availability goes up, and therefore sales rise dramatically. There are still some slow movers that the company is not addressing, so while margins improve from the previous scenario, they are still not achieving their full potential. However, turns more than double and now the company has a profit of $2 million.

But we are not finished. Viable Vision takes us to the next level using Throughput Per Shelf (TPS). In this paradigm, we are quickly exchanging slow movers. Sales improve dramatically. Inventory stays the same. We changed transportation logistics and so operating expenses increased. Yet we are left with almost double inventory turns again, and 4.5 times the net profit.

The consumer goods Viable Vision requires extensive sales training and practice. Salespeople must learn which prospects are suitable, and how to ask the right questions to find out. They must be able to do something totally foreign in retail – ask for higher margin for the same product, when the customer is selling more of the supplier’s goods.

Why would a retail customer be willing to pay a supplier more per unit, when they are selling more of the same product? If a retailer’s gross profit per square foot of shelf space doubles per time period, a 5% increase in price, even when they cannot pass that increase on to the consumer, still leaves them with a fortune. It still is much better than any competitive offering without TPS capability. However, it still must be professionally presented by a well trained business deal sales force.

These two examples provide a brief overview and a very small percentage of the current Viable Vision knowledge.  Viable Vision implementations have been improved and simplified extensively over the past several years, to achieve results faster and faster with less strain on resources. It is a rapidly evolving, immense body of knowledge relative to how to accomplish major improvement in any size organization. The steps which are generally followed to identify and implement a Viable Vision are described next.

Five Steps to Viable Vision

Five steps are absolutely essential to identifying a Viable Vision and executing correctly. If any one step is missed or executed out of sequence, then the entire effort will be in jeopardy.

Step 1—Collect the data to identify the organization’s leverage point, and the Viable Vision needed to exploit it.

When the Viable Vision process first started, it was common to examine the flow of products and services through a supply chain, of which your company is one piece. A person analyzing the data would look for where is the flow blocked? What is the source of the blockage? How common is this in the industry? What damage is done to the customer, when this blockage occurs?

For example, if there is lots of inventory in the supply chain right through to the end consumer of the product, but there are still many items out of stock in any given location, then the leverage point is clearly with the TOC replenishment solution.  The Viable Vision process will use the return on inventory to create a decisive competitive edge.

Some company salespeople bring many prospects to their door and then waste them—they don’t close the deal. Why not? In a Viable Vision, it would not be unusual to see close rates approaching greater than 50%.

In other cases, the company is tapped out of prospects in the markets they serve. They may have a high market share or they may not have achieved a competitive edge, even with a superior product. To reach a Viable Vision, that company may need to explore new markets, or create their own unique “Mafia Offer” – an offer that is too good to refuse for existing or new markets.

However, if creating such an offer requires new products to be developed, the company could suffer for a long period of time before tangible improvements are reached. A Viable Vision must do better than simply relying on new product development.

While over 70% of all companies are currently constrained by not having enough customers to buy their products, there are other possibilities. For example, a company may not be able to produce enough to meet the market demand. This may be a production logistics problem or a project management problem. Sometimes, even when the constraint is in the market, the correct answer to address the problem lies in changing manufacturing logistics to reduce lead time, improve reliability or for other reasons.

The constraint might be in the distribution channel, with suppliers or in engineering or even in sales. Regardless of where it is, the first step is to correctly identify the organization’s biggest leverage point.

Step 2—Gain the buy-in of the CEO to the Viable Vision

Viable Vision is a top down approach. What the CEO understands and supports gets done.

This critical dogma is not just a Viable Vision concept. It has been proven through research and empirical evidence and stated in the most popular management books—Good to Great, Execution, Six Sigma, Lean Thinking and many more.

In the Viable Vision process, one successful approach, that lends itself to further buy in from the top management team, is to draft a “straw man” Strategy and Tactics to achieve the Viable Vision. The draft Strategy and Tactics details, for each functional area, the required elements to achieve the Viable Vision. Usually, the CEO goes through a few iterations of the Strategy and Tactics document until he/she understands, agrees and is fully committed to supporting it. It makes no sense to move forward with the process unless the CEO fully understands how the Viable Vision will be accomplished, what the necessary strategy and tactics are, the assumptions behind the financial achievements and the strong desire to achieve the results. It is rare that a CEO has turned down such an opportunity. However, if a CEO has a different vision or is not prepared to make the Viable Vision Project THE MAIN PROJECT of the company for four years, the process will stop at this point.

It is important to note that even though the CEO has taken over ownership of the S&T at this point, his / her team has not. Therefore, it is a straw man S&T until the entire management team has scrutinized it, bought in and is committed to it.

Step 3—Gain the buy-in of the entire top management team

CEO buy-in is necessary, but not sufficient, to ensure the successful paradigm shifts for a Viable Vision. Therefore, the next step is to help the top management team understand why, for so long, their company was blocked from exponential growth.

Before all of the top managers can accept a Viable Vision solution, they must see a road map that makes sense. They must understand the systemic changes that they will take responsibility for implementing in manufacturing logistics, supply chain replenishment, project management, marketing and sales.

In the Viable Vision process, this step is accomplished in a one-day joint working session with the top management team, led by a Viable Vision expert. 100% top management team concurrence is necessary to proceed.

Step 4—Strategic Planning Kick-Off / Overview Education

Before building a strategy, all of top management must see the company through the same eyes. The current process follows a strategy and tactics road map, which has the following components to several levels of detail (most of the current templates are taken to four levels of detail):

  • A Strategy – What we want to accomplish
  • Existing assumptions that explain why this specific strategy was chosen
  • The tactic(s) needed to accomplish the strategy
  • Assumptions which explain conditions that exist which the tactic(s) must overcome or existing conditions which allow the tactics to work so well in achieving the strategy.

For example, when working to identify target markets in consumer goods companies, we know how easily salespeople can get turned off by pursuing the wrong prospects. It is so easy for them to jump to the conclusion that this Viable Vision stuff just does not work. We also don’t want to waste their time with useless prospects. These assumptions explain why our strategy must be to have salespeople know which prospects are the best ones for the Inventory Turns offer.

To get to a valid tactic, we must know some details about our target market. For example, one assumption we will use is that the greater the number of SKUs, the more slow movers you tend to find, and therefore the more powerful the offer. Now it’s obvious that one of the characteristics we must look for in a target market is the right range of number of SKUs.

The process takes each block of the strategy and tactic structure and presents it to the company team. As the strategy and tactics are outlined in more and more detail, there will be a point where some of the detailed knowledge of the application (manufacturing, distribution, marketing, sales, project management) is conveyed to the group. With this knowledge, the group is able to define any reservations they may have about the solution (specific element of strategy or tactic).

Every reservation is gone over rigorously, either to prove that it is already taken care of in the strategy and tactic structure or it is noted as a point to consider during implementation. At the end of the process, which is best kept to no more than 2 days, the project plan is put together by assigning team members to each relevant piece of the structure at the most detailed level.

Step 5—Implementation

After a successful kick-off, Viable Vision becomes the company’s only major initiative. Every top manager is directly involved. Viable Visions use the TOC Project Management approach called Critical Chain. The project is actually planned to be achieved in 2.5 years. The remainder is a buffer. When the Viable Vision process is working correctly, significant results should be observable in weeks or at most, a few months.

Summary

In America today, executives are given about 20 months to prove themselves by delivering increased profits – bottom line results. In 57% of the companies surveyed in a three year period, CEOs failed to do so and were fired. What about in your country? It is just my humble opinion, but from my worldwide experiences, I see all countries having great challenges in technology, productivity and quality.

Many countries around the world are coming out of a long period where productivity was measured much more by internal country standards than by international standards.  Yet to be successful and to enjoy real growth in personal wealth, you must be able to compete in business on the world playing field.

China, India, Vietnam, Korea and other emerging players are hot on everyone’s heels, not just in the cost of products, but in quality and design innovation as well. The Chinese have accomplished in 20 years what took the Americans and Japanese over 100 years to achieve. Malaysia and India are paying attention, and their economies are poised to boom over the next decade. The pressure is on your executives and managers to perform miracles.

Over the past three decades, most countries have had major improvements in schooling, especially in business. Business people have proven their ability to work hard and compete in the international arena. But the pressure of the advances in foreign competition took its toll. Today, hard work and low wages are simply not enough to win. Amazingly, the 9 countries I have worked in over the past 22 years [2] all take a similar approach, and bring comparable management skills to their work. What now is the key to drive a company to success?

My answer is that the key to success is the same one that is working equally well worldwide. Viable Vision is the logical extension of Dr. Edwards Deming’s work of the last century. Viable Vision brings the management team to identify and exploit its biggest leverage point for improvement. It focuses the now precious human resources on those key constraints of the business. It aligns the management team not just to work in harmony, but to work in the correct sequence on the right initiatives to achieve huge success. It overcomes one of the biggest constraints to any organization’s growth – the market – by identifying new and unique ways to bring major value your existing and your competitor’s customers.

Any country’s business management has a great, but limited history of achieving results. At the same time, every country has major obstacles to overcome. Viable Vision is, I believe, the missing ingredient to drive new, high growth and secure the future.


[1] Goldratt is the founder of the Theory of Constraints (TOC), author of the multi-million bestselling book, The Goal and several others, including Critical Chain, Necessary But Not Sufficient, It’s Not Luck, The Haystack Syndrome and The Theory of Constraints.

[2] Malaysia, Bangladesh, Australia, Switzerland, Italy, Canada, Poland, Germany and United States


8. Building Consensus with Stakeholders (Keita Asaine)

We are continuing to publish articles for the book Theory of Constrains in Practice from the TOC Strategic Solutions Library. It is a collection of cases and articles by TOC experts and practitioners from all around the world sharing their knowledge and experience gained in TOC implementations.

This chapter was written in the period of 2011-2014.

Keita Asaine_photoDr. Keita Asiane

Dr. Keita Asaine is the President of Juntos Co. Ltd., Japan, and a Founding member of TOCPA – TOC Practitioners Alliance. Keita has TOC experience as a practitioner, trainer and consultant since 2004. He has a Ph.D. in Engineering from Kyushu Institute of Technology (KIT) in Japan. He teaches TOC-TP, Production and Project Management for Masters program at KIT.

keita@juntos.co.jp

http://www.juntos-consulting.com/


Abstract

This article highlights the issues of input availability in Japanese public-work projects, such as late delivery of purchased equipment/materials and missing instructions from customers. These problems cause delays in construction scheduling and increase budget costs which are considered to be the result of a lack of synchronization between procurement activities and process control. In an attempt to overcome a lack of synchronization, the Japanese government runs “One-day Response” initiatives to prevent work stoppages in construction projects.

In Japan, many construction companies engaged in public works have tried to implement CCPM (Critical Chain Project Management) in order to shrink project lead-time and reduce project costs. However, the following comments are often heard from them:

–  Some managers follow the procedures of CCPM exactly, but others do not.

–  As time passes, after the implementation of CCPM, there is a tendency to revert to previous procedures.

We need to understand the reason why it is difficult to sustain the use of CCPM and how to make it more user-friendly.

We would like to highlight these aspects and share our experience in implementing CCPM. This article looks into how to build consensus within a company in order to continue the use of CCPM, and how to better enable synchronization between procurement activities and process control.

  1. Introduction

As it is well known, natural disasters such as earthquakes, tsunami, and typhoons occur frequently in Japan. For this reason, the Japanese government has regularly increased the budget for development and maintenance of the country’s infrastructure. However, Figure 1 shows that the budget for public works in Japan has been decreasing since 1996 and this downward trend is expected to continue. Most companies in the construction industry seek to secure the competitive edge needed to shrink project lead-time and reduce costs through more effective construction management [2, 3 and 4].

Slide1

Figure 1: Trend in investment in construction [1]

On the other hand, in order to resolve problems confronting construction projects, constructors need the MLIT (Ministry of Land, Infrastructure, Transport and Tourism) to respond rapidly [5]. Therefore, since 2007, MLIT has been offering “One-day Response” initiatives to authorize activities when problems occur on construction sites [6]. These initiatives are intended to contribute to shrinking construction project lead-times and reducing costs for contractors. Additionally, MLIT asks contractors to create a mechanism to immediately report the impact of the project – scheduling and costs when problems occur. CCPM has supported “One-day Response” initiatives [7, 8 and 9].

In some companies, however, CCPM does not become the established new way of management. Some managers follow CCPM explicitly while others revert to previously employed procedures.

This article investigates the difficulty of continued use of CCPM through a case study.

  1. Attempts at Implementing CCPM

A Case Study

The company is a sub-contractor in charge of managing workers and procurement of materials and equipment. Their management activities are carried out with the cooperation of contractors.

Figure 2 shows the relationship and roles of each stakeholder. The role of the project manager, who is the client, is to communicate with government and to manage equipment and materials. The role of the project leader is to instruct the work force and to procure resources.

Slide2

Figure 2: The relationship and roles of each stakeholder

The company has several UDEs (Undesirable Effects) as following:

– There are too many cost overruns

– Many projects take longer than expected

– It is often a struggle to meet deadlines

– Resources (workers, equipment/materials) and inputs are not available when needed.

– Priorities constantly shift

The company implemented CCPM in 2006 in order to resolve the above UDEs. First, the company performed an internal seminar for the general manager and all project leaders in order to learn the software and the essence of CCPM. After that, they developed 3 rules as follows,

At the planning phase:

Rule 1: a project leader makes buffered Critical Chain schedules.

At the execution and control phase:

Rule 2: a project leader obtains the estimation of task completion, updates the software every day, and reports the Buffer Penetration to the general manager.

Rule 3: the general manager makes a decision for recovery actions as needed.

As time passed with the implementation, some project leaders continued to follow the new rules, but others reverted to previous ways. We investigated the reasons why these project leaders stopped following the new rules. At the planning phase, the general manager was always saying “shrink project lead-time” and “reduce costs” without giving actual suggestions and advice. Therefore, the project leaders could not communicate effectively with the project manager concerning schedules and delivering of equipment/materials.

At the execution and control phase, project leaders and the general manager did not know how to manage and make decisions according to the status of buffers. Therefore, the project leaders could not provide clear instructions to workers. Similarly, the general manager could not give instructions and take recovery actions for project leaders. As a result, these project leaders could not achieve shrinking project lead-time and/or reduce costs.

We analyzed the problems outlined above. Project leaders regularly collected information according to the rules. However, project leaders and the general manager did not know how to use this information to make the required managerial decisions. Project leaders could not obtain the desired effects so they stopped following the rules. We found that the procedures and guidelines for management were ambiguous. In addition, the company could not develop clear managerial and operational procedures, as they had been based on the discretion of each project leader.

  1. Direction to solving the problem

The general manager attended the Goldratt Schools workshop in order to resolve the issues. He learned the TOC solution for single project management [10] – the essence, knowledge, mechanics/procedures and implementation plan of nine CCPM Injections.

Slide3

Slide4

Slide5

Figure 3: 9 CCPM Injections, presented with the permission by Oded Cohen


After the workshop, the general maanger identified two changing points as follows:

  • How to assign and allocate workers to tasks
  • How to arrange inputs – equipment/materials and approvals

How to assign and allocate workers to tasks

In the planning phase, the company assigned the same number of workers to all tasks. Actually, the number of workers that should be assigned to each task is different. If the company fixed their number, some tasks would be short of workers. Figure 3 shows a concept of ways to assign workers. If shortages of workers occur for each task, project lead-time is extended. On the other hand, even if there are too many workers for a task, project lead-time is not always shrunk. The workers often wasted time – Parkinson’s Law. As a result, they had too many cost overruns.

Slide6

Figure 4: A concept of ways to assign workers

We investigated the reasons why the numbers of workers to all tasks were fixed. The project leader keeps track of the progress of the project, and has to check the current status of the workers needed for the next task and its level of readiness. However, the company did not establish clear procedures and guidelines to accomplish this. Therefore, some project leaders did not secure the workers when needed. Even if they understood procedure and guideline, they did not know how to communicate with 2nd sub-contractors about the need for flexible arrangements of workers.

Afterwards, in order to resolve the above issues, the company established clear procedures and guidelines – the mechanics of wake-up calls for workers (injection 6). After that, top management and the general manager, explained the new procedures to 2nd sub-contractors. Specifically, they developed and built this knowledge together with the 2nd sub-contractors – Problems, Benefits and Risks.

How to arrange inputs – equipment/materials and approvals

The project manager / client usually arranges for materials such as rebar and approvals such as road-use. If the project leader frequently fails to report to the project manager that keeps track of the progress of the project, inputs are not available when needed. As a result, project lead-time is extended, and / or they have too many cost overruns.

We asked all project leaders (the company) and 15 project managers (client) in order to understand current reality about inputs availability. Figure 4 shows the subjective evaluation about inputs availability. We had recognized that project leaders feel dissatisfaction about inputs availability inputs more than project managers. In addition, we interviewed them in order to understand the above issue.

Slide7

Figure 5: The subjective evaluation about inputs availability

Most project leaders thought that to be operated passively, by following the instructions from the project manager, is the way to match with the customer demand. Therefore, the project leaders had arranged inputs according to the instructions of the project manager. Furthermore, the project leaders kept track of the progress and remaining duration of the project, but they were not able to report it frequently to the project manager. On the other hand, in general, the project managers generally confirmed the current status of the project with the project leader. However, each manager needed different kinds of information to be collected and when the information had to be available. Therefore, many project managers had to make subjective decisions based on intuition and experience rather than actual timely information. To resolve this problem, it was necessary to carry out a “Wake-Up call” initiative, the mechanism to monitor/manage the availability of inputs – equipment and materials, and approvals from the government.

Finally, the project leaders and general manager were able to follow the new technical procedures and mechanics on how to obtain necessary information – call for “Information Flow”. However, even so they did not know how to utilize the information obtained – call for “Decision Flow”. As a result, it became necessary to have new managerial procedures and mechanics. Therefore, the company established the procedures based on “Information Flow” and “Decision Flow”.

  1. Establishing the Procedure

We investigated the details of the procedure the company established – composed of “Information Flow” and “Decision Flow”.

Planning Phase

Figure 5 shows a part of the procedure for identifying the Critical Chain, inserting Buffers, creating a list of inputs and determining the start date of a project.

A project leader creates a project plan according to “Information Flow” as follows:

[P-1]      To create the project planning diagram and input the project plan into software.

  • Develop dependency diagram
  • Agree upon and record the resources needed for each task
  • Estimate task duration, challenging the project leader and agreeing on “challenging but achievable” estimations

[P-2]      Resolve resource conflicts.

[P-3]      Identify the Critical Chain.

[P-4]      Make a decision whether the identified Critical Chain is good or not. The good Critical Chain contains the specific tasks to which the management should pay attention.

[P-5]      If the Critical Chain is not acceptable, adjust the duration of the key task or its surrounding tasks. After that, back to resolve the resource conflicts [P-2], again.

[P-6]      If it is, insert Buffers.

On the other hand, after creating the project planning diagram [P-1], make an inputs plan as following:

[P-7]      Create a lists of inputs needed for each task.

Slide8

Figure 6: A part of procedures in the planning phase

Slide9

Figure 7: The actual lists of inputs

Slide10

Figure 8: The actual lists of inputs

[P-8]    Determine a wake-up time for each input.

Figure 6 shows the actual lists of inputs. In general, a project leader checks 3 times per each item.[P-9]         After finishing  [P-6] and [P-9], complete creating the project plan.

The general manager receives the project plan created by the project leader and makes  “Decision Flow” decisions as follows:

[P-10]    Make a decision whether the project lead-time will meet the target due date or not.

[P-11]     If not, perform an adjustment according to the guideline as follows:

  1. Offloading available?
  2. Parallel-performing available?
  3. Additional resources available?

And so on…

After that, back to check the lead time [P-10], again.

[P-12]    If yes, determine the time of starting the project.

A project leader receives the project plan approved by the general manager, and communicates with a project manager  following “Information Flow”:

[P-13]    To have a meeting with a project manager (the client) about the project plan.

[P-14]    A project manager makes a decision whether or not he agrees on the plan.

If not, back to creating the project plan [P-1], again.

[P-15]    If yes, a project leader goes to the site on the agreed upon start date.

Every project leader shares the quality project plan through the quality check process according to the above planning procedures. Due to this procedure, every project leader has a good working collaboration with their general manager. As a result, every project leader has confidence in their project plan. And, as a good project plan makes the meeting with a project manager more effective, communications with the client are improved.

Execution and Control Phase

Figure 7 shows a part of the procedure for assigning priorities to tasks/inputs/projects, allocating resources and taking recovery actions.

A project leader keeps track of the progress of “Information Flow” as follows.

[E-1]    Ask workers for the remaining duration estimate, check the list of inputs.

[E-2]      Check whether the item is available or not.

[E-3]      If yes, put the check mark “OK” on the list.

Slide11

Figure 9: A part of procedures in the execution and control phase

[E-4]      If not, ask the vendors and/or the project manager for their remaining duration estimate until the input is available.

[E-5]      After finishing [E-1, 3 and 4], update the Buffer Penetration Report.

After that, a project leader makes a decision on his project according to “Decision Flow” as follows:

[E-6]      To assign priorities to open/upcoming tasks and inputs based on the status of their corresponding Buffers status according to the guideline,

  1. To give a top priority to the task/input penetrating into the PCB –Project Completion Buffer.
  2. To prioritize other tasks/inputs according to the percentage of penetration into the corresponding FBs.
  3. And allocate resources based on priorities.

Meanwhile, the general manager receives the Buffers Status Report from all project leaders three times per week, and makes a decision according to “Decision Flow” as following:

[E-7]      Assign priorities to all projects according to the status of their PCB.

[E-8, 9]  Check what the status of PCB is.

[E-10]    If the status of PCB is GREEN, do not take any actions.

[E-11]    If the status of PCB is YELLOW, check assigning priorities and allocating resources to tasks/inputs, check the situation, and identify the blocking factors.

[E-12]    If the status of PCB is RED, make a decision to put more resources.

[E-13]    If more resources are not needed, check whether inputs are delayed or not.

[E-14]    If yes (inputs are delayed), a project leader must discuss the situation with a project manager (Client) and vendors according to the guideline as follows:

The project leader arranges:

  • To negotiate with vendor again.
  • To request partial delivery.
  • To change to another vendor.

And so on…

[The project manager (client) arranges:]

  • To report current status of the progress and discuss with the project manager about recovery actions.

[E-15]    If not (inputs are not delayed), allocate resources to the prioritized task, and provide clear direction to the project leader.

[E-16]    If yes (more resources are needed), check whether or not more resources are available from other projects.

[E-17]    If not (resources from other projects are not available), arrange for external resources.

[E-18]    If yes (resources from other projects are available), contact the project leader.

[E-19]    After that, produce a resource allocation plan, and communicate with the associated project leaders.

[E-20]    Each project leader receives a clear direction [E-15, 19] from the general manager. An explanation is provided and the associated resources are identified.

On the other hand, the general manager checks as follows:

[E-21]    Check whether the status of PCB is recovered or not.

[E-22]    If yes continue to monitor the passage afterwards.

[E-23]    If not, consider alternative action and indicate the recovery steps.

In the execution and control phase, according to the procedure, every project leader is able to have appropriate support such as checking the priority of tasks/inputs and recovery action from the general manager whenever needed. Then, every project leader has good collaboration with the general manager. As a result, every project leader has confidence about the management of their own project. And, they are able to gain the trust of the project manager.

  1. Results

Subjective assessment

We interviewed all of the managers of the company about the changing points according to a comparison between before implementing CCPM – “Before” and after implementing CCPM – “After”. Figure 8 shows the subjective assessments of delivery, costs and quality. Every item is improved.

Slide12

Figure 10: Subjective Assessments

Objective assessment – Operational results

We analyzed delivery and costs according to comparison between “Before” and “After”. The number of “Before” target projects is 17 projects, and “After” target projects is 18 projects. Figure 9 shows the specific operational results of delivery and profit.

We verified DDP (Due Date Performance) and Project lead-time as delivery. Some of the operational results are as following:

  • The due date performance improved from 52.9% to 94.4%.
  • The average project lead-time shrank from 119 days to 96 days – reduced by 18.3%.
  • The gross profit ratio improved from 2.8% to 15.9%.

Slide13

Figure 11: Objective Assessment – Operational Results

Financial result

Figure 12 shows the achieved financial result compared to the industry average. After implementing CCPM, the net profit ratio of the company has been improved year by year from 0.40% in 2006 to 4.35% in 2008. By comparison, the industry average net profit ratio decreased year by year from 0.52% in 2006 to -1.30% in 2008 [11]. The president of the company said that reliability had increased due to improved communication with clients.

Slide14

Figure 12: Objective Assessment – Financial Results

  1. Conclusion

Through the case study, in order to continue the use of CCPM, several important points are noted: The “Information Flow” and “Decision Flow” should be translated into clear procedures with the deployment flow chart. For roll-out of procedures, we have to build a consensus with the relevant people – project leaders, general manager and top management.

The important issue to deal with is the gap and frequent conflicts between the Gemba (frontline managers such as project leaders and supervisors) and top management.. From the Gemba point of view, when they ask the top management to help, they frequently get the answer “do your best”. It leads to Gemba’s mistrust of the management. On the other hand, from the managerial side’s point of view, Gemba always calls for expensive actions. It leads to the managerial side’s mistrust of Gemba.

The Gemba and the top management have the same objective – managing projects better! However, they do not have a way to understand each other’s views, which brings mutual mistrust. Understanding the procedures and guidelines leads to gaining mutual trust.

Basically, project leaders or project managers have a lot of experience and skills to manage projects effectively. However, in some cases project leaders or project managers need support from the upper management. In public works, Gemba and top management are located geographically far from each other. So, it is likely that the top management will have a lot of difficulty providing timely support to the projects under their responsibility. CCPM provides information clearly and quickly from the Process Flow or flow of the project. However, if the management do not give timely support, then project leaders and project managers stop sending the information. It is not due to the lack of the ability of individual managers but due to the lack of tangible managerial procedures and guidelines. Establishing managerial procedures and guidelines are a critical success factor in executing CCPM and ensuring a good collaboration within a company because they create the bridge between Gemba and top management.


Reference

  • MLIT(Ministry of Land, Infrastructure and Transport): P​r​o​s​p​e​c​t​ ​o​f​ ​c​o​n​s​t​r​u​c​t​i​o​n​ ​i​n​v​e​s​t​m​e​n​t​ ​i​n​ ​f​i​s​c​a​l​ ​2010, ​O​u​t​l​i​n​e​ ​a​n​d​ ​t​h​e​ ​g​i​s​t, ​ 6
  • Research Center for Land and Construction Management, National Institute for Land and Infrastructure Management, MLIT: Guideline for Value Engineering at the Design Phase, 2004.4
  • MLIT: Report on the Introduction of Design-Build System into Public Works in Japan, Committee on the Introduction of the Design-Build System, 2001. 3
  • Takasaki H., Yamaguchi S., Yuasa Y., Isobe T., Murakami S., Miura T.: A Study on project management applied for civil engineering field, Journal of geological engineering, No.721, pp.153-165, 2002.12
  • Research Center for Land and Construction Management, National Institute for Land and Infrastructure Management, MLIT: Interim report about construction management system to support local offices of MLIT, 2006.9
  • MLIT : About implementation of One-day Response, 2007.3
  • Kishira, Y.: A case study of reengineering public works management at a Japanese government ministry through a “P2M” based program and project management method, ProMAC, 2006.11
  • Kochi Prefecture, Public Works Dep.: One-day Response project,4
  • Aoyama H.: A case study for Meishi National Highway Office MLIT, Win-Win-Win Public Work International Conference 2008, 2008.11
  • Goldratt Schools : Project Management The TOC Way, 2010
  • West Japan Construction Surety Co.,Ltd.: Financial data in construction ​industry i​n​ ​f​i​s​c​a​l​ ​2010, http://www.wjcs.net/shihyo/img/keieishihyo.pdf, 2011


All materials available on the TOCPA site are the intellectual property of their authors and cannot be reproduced in any other media and used for any purposes without the prior permission in writing of the authors.

7. Applying manufacturing flow theory to construction management (Stratton, Koskela, AlSehaimi and Koskenvesa)

We are continuing to publish a new book Theory of Constrains in Practice from the TOC Strategic Solutions Library. It is a collection of cases and articles by TOC experts and practitioners from all around the world sharing their knowledge and experience gained in TOC implementations.

This chapter belongs to a collection of vintage articles written by leading TOC practitioners.  It was first published in 2010.

Stratton et al., 2010. Applying Manufacturing Flow Theory to Construction Management. Proceedings of the Interantional European Operations Management Association Conference Porto, Portugal.

The authors:

7-Roy Stratton

Dr. Roy Stratton is Associate Professor on Operations and Supply chain Management at Nottingham Trent University in the UK. His research into managing flow in complex environments extends across healthcare and construction environments. He runs an MSc in Theory of Constraints.

roy.stratton@ntu.ac.uk

Nottingham Trent University, Nottingham, NG1 4BU, UK


7+Lauri KoskelaProfessor Lauri Koskela is Professor of Construction and Project Management at the University of Huddersfield in England. He is a founding member of the International Group for Lean Construction, and has contributed to the theory of Lean Construction.

l.koskela@hud.ac.uk 

The University of Salford, Salford, M5 4WT, UK


7-Abdullah AlsehaimiDr. Abdullah Alsehaimi  is a head of civil engineering department, college of engineering in Yanbu, Taibah University, Saudi Arabia. He is also the general supervisor of the medical city projects – a teaching hospital (400 bed) and medical colleges which all under construction.

A.O.Alsehaimi@pgr.salford.ac.uk

The University of Salford, Salford, M5 4WT, UK


Anssi Koskenvesa is a Finnish entrepreneur, trainer and researcher in the field of construction production and production planning. He has been involved in Lean Construction since 1993 and a founding member of the International Group for Lean Construction.

Koskenvesa@mittaviiva.fi

Tampere University of Technology, Tampere, Finland


Abstract

Both lean and Theory of Constraints (TOC) applications are now commonly reporting success in the application of flow concepts to construction management, namely, lean construction and Critical Chain Project Management (CCPM). Both approaches are concerned with improved flow through synchronization and reduced waste, but the means by which this is achieved are distinctly different. This paper reports on the conceptual similarities and distinctions of CCPM and lean construction based on secondary sources together with separate case and action research studies previously published by the authors.

Keywords: Critical Chain, Lean Construction, Last Planner

Introduction

Theory in operations management has undergone significant change in the past 40 years with a shift from an economic cost-based view to one emphasizing flow and the drive to continually eliminate waste and manage variability. The emphasis on variation and waste reduction are most notably associated with Deming (1982), Ohno (1988) and Womack et al. (1990) and now the term Lean. Whereas the strategic management of variation and uncertainty emerged with Skinner (1974), Hill (1985) and more recently Goldratt (1990) and Hopp and Spearman (2000) who more explicitly use the concept of variability buffering.

This shift in manufacturing thinking has not been so evident within the largely separate operations field of project management, where the underlying theoretical basis for project planning and control remains largely cost focused and has not significantly changed in over 50 years. For example, it has been long acknowledged that the planning and control tools, such as network planning and scheduling, do not effectively supported project management generally, and construction management in particular, with Fondahl’s (1980) experience remaining common today.

All too often, however, only the original plan and scheduling data are ever produced. They continue to cover the office wall long after they are obsolete and bear little resemblance to the current progress of the job.’

(Fondahl, 1980).

This paper attempts to bring together two independent developments in project/construction management that address this issue by translating manufacturing flow concepts into the field of construction management, namely Lean Construction (LC) and Critical Chain Project Management (CCPM).

  • The International Group for Lean Construction (IGLC) was formed in 1993 and although Lean Construction embodied the flow and continuous improvement principles of lean manufacturing, few of the associated manufacturing tools were applicable. Hence, practical approaches emerged and today best practice is closely associated with Last Planner (Ballard, 1994) which will form the basis of this paper’s interpretation of lean construction (Koskela and Ballard, 2006).
  • CCPM (Goldratt, 1997) is a natural development of the Theory of Constraints (TOC) approach to managing flow in manufacturing, entitled Drum, Buffer, Rope (DBR) (Goldratt, 1990). CCPM, like DBR, utilizes time buffers to synchronise uncertain activities and is centred on flow rather than cost control. Over the years this approach has been refined and this paper’s interpretation of CCPM is based on the CCPM Strategy and Tactics tree (Goldratt, 2007) developed to support the implementation process.

Specific questions to be addressed in this paper are:

  • How and why do the conceptual approaches work?
  • What evidence is there to support the claimed benefits?
  • How and why do these two approaches theoretically relate?
  • What are the wider implications for construction and project management?

In addressing these questions the authors have drawn on both secondary sources and their primary case and action research knowledge of such implementations (AlSehaimi et al., 2009; Koskenvesa and Koskela, 2005; Stratton, 2009).


How and why do the conceptual approaches work?

The main features of LP and CCPM are outlined below with a theoretical explanation.

Last Planner

The Last Planner system (LPS) was developed piecemeal, in response to the discovery of additional functions needed in order to manage the problem of work flow variability. This can be classified as follows: Ballard (2000)

  • Firstly, by incorporating ‘look ahead planning’ and the ‘make-ready’ process, construction managers are able to ensure that materials, information and equipment are available.
  • Secondly, it allows for filtered planned activities through the weekly work planning procedure, thus making sure that the preceding activities have been completed.
  • Thirdly, it secures the voluntary and reliable commitment of the workforce by the leaders of the work teams involved.

Moreover the important role of the Last Planner tool is to replace optimistic planning with realistic planning by evaluating the performance of workers based on their ability to reliably achieve their commitments.

The concept of the Last Planner System has five main integrated elements (Ballard and Howell, 2003; Mossman, 2007), namely, master planning, phase planning, look ahead planning, weekly work planning and percent plan complete.

  • Master Plan is a general plan that identifies all the work packages for the whole project showing the main activities, their duration and sequence. The aim is to bring all the major actors together early in the process where assumptions are tested and best practice agreed on.
  • Phase Planning is about dividing the master plan into various phases to develop more detailed work plans and provide goals that can be considered targets to the project team. Phase planning similarly involves representatives of all organizations in order to develop a more detailed work plan for the different parties (contractor, subs, client, consultant, suppliers, etc) involved in the phase.
  • Look Ahead Planning is about making tasks ready so that they can be done when the right time comes. The objectives of look-ahead are to reduce uncertainty, identify and eliminate constraints to achieving the project objectives in the look-ahead period, which typically varies from 4-8 weeks. ‘Making ready’ ensures that tasks are ready for production when required, thereby reducing waste in time, materials and equipment.
  • Weekly Work Plan (WWP) is the collaborative agreement over the production tasks to be completed within the next week. WWP is produced based on look ahead planning where efforts should be made to defined what will be done given the resources available. The purpose of the weekly meeting is to communicate progress, plan the following week and make ready for the future. This helps to explore any inter-dependencies between resources, access, and equipment. The WWP meeting covers the weekly plans, safety issue, quality issue, resources, construction methods, and any problems that occur in the field.
  • Percent Plan Completed (PPC) & analysis of reasons for non-completed tasks. This is about improving the project planning by continual assessment and learning from failure. PPC is a measure of the proportion of promises made that are delivered on time. Having measured the PPC it is then necessary to identify reasons for non-completion, and tracing reasons back to root causes that can be eliminated to prevent repetitions. Additionally, over time PPC statistics show where more attention should be paid to yield better results. This in turn can assist improving the learning process over the project period and over projects.

7-Fig 1

Figure 1 The Last Planner System (LCI, 2001)

In the Last Planner System the sequences of implementation of the above mentioned elements set up an efficient planning framework through a pull technique. This is summarized in Figure 1 as Should, Can, Will and Did which are the key terms in the weekly work plan (Ballard, 2000). Should reflects the preferred priority, Can what is possible now given availability, Will the commitment and Did what was achieved and reported by percentage planned completed (PPC). Traditional practices do not consider a difference between what Should, Can, and Will be done, the assumption being that pushing more tasks will result in better results. The general idea is that in order to obtain an even workflow, a weekly work planning and a careful monitoring of the plan performance is needed. This takes place through the weekly plan, prepared on site and as close as possible to the week in question. The weekly plan defines what Will be done and PPC tells what Did get done.


Critical Chain Project Management

A central driver for adopting CCPM is enabling more predictable and shorter project lead times. The argument is that this not only will enhance time-related order-winning criteria but will also reduce cost and improve adherence to specification. The main conceptual elements and distinctive features of CCPM relate to planning, execution and improvement as detailed below (Goldratt, 2007).

Project planning

  • CCPM takes account of resource as well as precedence dependencies in determining the project duration. This is termed the critical chain. In Figure 1, the critical path would be denoted by activities 1-3-4, whereas in CC it is denoted by 1-3-2-4 due to common resource B. In such cases, the critical chain is shown to be longer than the critical path and all four activities need to be managed accordingly.


7-Fig 2

Figure 2 Network diagram (left) and critical chain schedule showing buffers (right) (Stratton, 2009) 

  • CCPM introduces the concept of project and feeder time buffers to accommodate the effective management of buffer time that is commonly wasted at the activity level when managed locally. The project buffer is located at the end of the project to protect the critical chain, and feeder buffers isolate activity sequences with float from the critical chain (see Fig.2). Thus, such buffers enable aggregation of the buffer time as well as better control, enabling both shorter and more controllable lead times. In establishing these buffers, the proposed start point is to halve existing activity times and put half of the remainder into the aggregated buffer. Therefore, the buffer is equal to a third of the activity and buffer combination (see Fig.2 for illustration).
  • When planning in a multi-project environment, CCPM advocates staggering the release of projects around a designated resource that acts as a drum. This is used to ensure flow and avoid too many open projects that result in excessive multi-tasking and missed due dates.

Project execution and continuous improvement

  • Task completion reporting

It is common practice for activity times to be reported in terms of work done, an economic measure that is often only formally reported weekly or even monthly. With CCPM the remaining time to complete the activity is reported on a much more frequent basis – ideally daily.

  • Provide visibility of upcoming tasks

As there are no intermediate task dates in the planning system the task-time-remaining data provides advanced notice of upcoming tasks (this has previously been referred to as a resource buffer).

  • Current and upcoming tasks are monitored in line with priorities to ensure tasks are effectively progressing.

In the more complex multi-project environment, there are many in-progress tasks competing for a resource provider’s time. In CCPM they are prioritised in terms of the ratio of critical chain completion and buffer consumption, commonly using green, yellow and red priority colour codes. Upcoming tasks are also displayed, indicating their relative priority as well as the projected time when these tasks are expected to become available to that resource.

  • Buffer consumption is monitored daily by the project manager and recovery action taken where necessary.

Consumption of the buffer indicates a task is exceeding the ambitious time and that the task manager may need assistance. Action at the project level may be needed to recover a situation.

  • Senior managers monitor the status of all projects and take action where necessary.

At this level, the priority status of all projects is reviewed periodically to monitor and address higher level programme recovery.

  • Reasons for delay are monitored and provide focus for improvement.

The relevant reasons for delay are extracted to focus improvement activity.

The planning and execution steps form the core of the CCPM approach but are not sufficient on their own. Pre planning steps involve reducing the number of live projects and ensuring that pre kitting is complete before a project is allowed to start.

What evidence is there to support the claims?

Objective support for the value of these two approaches can be both empirical and theoretical, as reported below.

Last Planner

The reported benefits, for all parties involved in construction projects, deriving from the implementation of Last Planner go beyond the initial theoretically justified benefits. These empirically observed benefits include: improved planning efficiency and reliability, improved productivity, improved plan reliability, more accurate prediction of resources, reduced uncertainty, preparation of team members to be in collaboration, enhanced learning process by continuous assessment, improved work quality and safety, and thereby reduced duration and cost of projects, promotion of other development work such as risk management, and facilitated implementation of organisational change and continuous improvement. These benefits are evident in many case studies reports and research papers across several countries (Ballard, 1994; Ballard and Howell, 2003; Kim and Jang (2005); Koskenvesa and Koskela, 2005; Mossman, 2007; Alsehaimi et al., 2009; Ballard and Howell, 1997; Koskenvesa and Koskela, 2005; Fiallo and Revelo, 2002; Ballard, 1999; Ballard et al., 1996; Junior et al., 1998; Thomassen et al., 2003).

Critical Chain Project Management

Case and survey research into the application of CCPM are still very limited. However, one measure of the level of interest in CCPM is the availability of CCPM-capable project management software. There is a growing range of software systems claiming to be CCPM-capable ranging upward in price from $250.

Realization the suppliers of the Concerto CCPM software has published customers’ case studies which include ABB, Delta, Boeing, US Marine Core Base, Lucent Technologies, Hewlett Packard and US Air Force Warner Robins Air Logistics Centre (Concerto Case Studies, 2010). Realisation has also been closely involved in the development of Goldratt’s (2007) Strategy & Tactic implementation guide, and the software is closely aligned with it. Using the Realisation Website (Concerto case studies, 2010) data, typical benefits include: reduced lead time by 25%; delivery performance increased to 90+%; and increased throughput by 20% with the same resource. Of these few have been formally published with one prominent exception, Warner Robins Air Logistics Centre (Srinivasan et al., 2007), where they implemented CCPM to reduce repair turnaround time on C-5 Galaxy transport aircraft.

In the construction sector, Stratton (2009) reported case research into a pilot implementation of CCPM using the strategy and tactics advocated by Goldartt (2007) in a multi project environment. This implementation was shown to follow the prescribed guidance with significant improvements in delivery performance and cost across 4 projects.

The use of CCPM on public works programmes in Japan since 2004 (Kishira & Ohara, 2005) has recently been expanded nationally through the Japanese government public works programme (Stratton, 2009) with reductions in duration averaging 20% and cost 7%.

CCPM has also been reviewed critically from a theoretical standpoint and the issues raised may be classified as follows.

  • OriginalityNumerous authors have acknowledge the approach (Newbold, 1998; Leach, 1999; Steyn, 2001, Herroelen, W. and Leus, R. 2001) but others question the originality. Trietsch (2005) is most critical in this area but does not question the contribution of the overall approach as does Raz et al. (2003).
  • OversimplificationSeveral authors (Raz et al., 2003; Elton and Roe, 1998) argue the approach brings more discipline but raise reservations over downplaying the traditional importance of personal project management skills.
  • Paradigm change / over complicationLechler et al. (2005) acknowledges the clear benefits but highlights the challenge in adopting a different mindset and suggests it could explain some failures. They suggest a CCPM-lite version that would not have feeder buffers (p56).
  • Pipeline schedulingRaz et al. (2003) question the stability of a bottleneck resource within a multi-project environment, as does Trietsch (2005). This is now acknowledged by Goldratt (2007) who now argues any limiting resource is likely to move, and the real issue in projects is not resource constraints but synchronization.
  • Buffer sizingThe introduction of buffers is widely acknowledged as a positive step in providing a means of managing uncertainty. Several authors raise question over the sizing of buffers and it needs to be acknowledged that there is no scientific basis for the buffer sizing.

Summary

Both LP and CCPM have been used productively over many years by practitioners but the nature of the environment makes the gathering of empirical research evidence difficult. CCPM has drawn more academic interest because of its broader application to project management and clear challenge to established project management practice and underlying theory. In both cases the value of the approach is supported by theoretical argument.


How and why do these approaches theoretically relate?

The review of LP and CCPM has clarified how these distinct approaches can be related to both reducing and managing variation and uncertainty. As with lean and TOC manufacturing, LP emphasizes waste reduction and CCPM the management of variability and uncertainty. It is, however, interesting to note how CCPM was a natural extension of DBR as both use time buffers. Whereas, LP represents a more radical departure form lean manufacturing. This may be explained by considering the strategic needs across the operations spectrum from project to line and the respective emphasis of managing and reducing variability. This might explain why LP elements could not be readily transferred from lean manufacturing whereas CCPM is more of a natural extension of DBR.


Planning

A clear distinction in these two approaches is the planning scope between Last Planner and CCPM. As the name suggests LP looks ahead up to 6 weeks to indentify what Should be done and ‘made ready’ but the main focus is on the detailed day to day planning over one to two weeks where what Should be done is reconciled with what Can be done (Fig 1) in establishing commitments about what Will be done. The LP system does not significantly contribute to longer term planning, giving little guidance on how to structure the master and phased plans.

CCPM conversely, encompasses the overall project plan, but does not address the day to day detailed planning. It is interesting to note that the S&T guide (Goldratt, 2007: 5,13,1) stresses the importance of the task activities not being too small (ie greater than 2% of the project lead time). This is to facilitate the control process and acknowledges the need to devolve the detailed planning to local decision making.

CCPM now embraces multiple project planning and the ongoing development of the approach is clearly evident in that a virtual drum is now advocated as a basis for staggering projects (Goldratt, 2007:15,13,3).


Execution

A key measure in LP is the percentage planned activities completed and this is

dependent on reducing uncertainty and coordinating activities in completing what is agreed on a weekly basis. Where the Should activity cannot be completed, a less critical substitute activity is prepared to ensure the resource is not idle.

In CCPM the control focus is on the ratio of consumption of the project buffer to completion of the critical chain and, therefore, the emphasis is on timely completion, hence prioritizing the Should over the Can activities. Although there is no formalized weekly planning meeting as in LP, the expectation is that projected activity completion dates are reported on a daily basis, although twice a week is possibly more realistic (Stratton, 2009). This, therefore, informs all involved of the status, as well as the priority of different activites, together with the significance of any delay. This status is then used to expedite activities or escalate additional resource requirements as required.


Improvement

LP as with lean is geared towards reducing waste and the associated uncertainty. A key feature of the weekly meetings is collecting information on the reasons for not achieving planned completions and targeting improvement. Although this was not originally part of CCPM this capability has recently been incorporated in some CCPM software and is key feature of the CCPM guide.


What are the wider implications for construction and project management?

Both systems address the need to plan and control in a highly uncertain environment:

  • LP though pragmatic and collaborative planning focusing on the immediate actions.
  • CCPM developing more formalized means of managing the uncertainty at the aggregate planning rather than detailed planning level.

This paper has helped clarify that the lean and TOC philosophies compliment each other and need to be reflected in any flow management systems. It is clear that both LP and CCPM have evolved to encompass common elements as in the case of CCPM embracing ‘make ready’ and targeted improvement. Although these approaches have been used in construction management for many years there development appears to be largely independent and the authors there is much potential in exploring their integration.

Although flow theory is clearly applicable to construction management more structured research is needed to verify these benefits and practically integrate the associated management and reduction of variation and uncertainty.

Conclusion

Generally, the starting point of development has a dominant impact on the initial nature and scope of the two approaches: Last Planner and Critical Chain. The LP method was developed in a design science research manner, to alleviate the practical problems of construction teams (Koskela and Ballard, 2006), whereas CCPM originated from an attempt to rectify shortcomings in the Critical Path Method, extending the TOC manufacturing application of time buffering. Traditional project management, as in the Critical Path Method (CPM), is based on a transformation concept of production. In this concept, the basic unit of analysis, the task, is atemporal and mutually independent except precedence relationships. The CPM procedure then finds the best order and timing of these tasks. Both CCPM and LP subscribe to flow conceptualization, which addresses how work actually flows, in time, through different stages of the project. However, these two methods pick up different foci in flow: CC operates through aggregated buffers, whereas LP endeavours to reduce the cause of buffers: variability. It is clear some of these distinctions have already diluted as the approaches have evolved in the same direction.

References

Alsehaimi A., Tzortzopoulos P. and Koskela L. (2009). “Last Planner System: Experiences from Pilot         implementation in the Middle East”, Proceedings of the 17th IGLC conference, Taipei, Taiwan, July.

Ballard, G. (1994), “The Last Planner”. Spring Conference of the Northern California Construction Institute, Monterey, CA, April 1994.

Ballard, G. and Howell, G. (1998). “Shielding Production: Essential Step in Production Control”, Journal of Construction Engineering and Management, Vol. 124, No1, pp. 11-17.

Ballard, G. (2000). “The Last Planner System of production control”, PhD thesis, University of Birmingham, Birmingham, UK.

Ballard, G., and Howell, G. (2003). “An update on Last Planner.” Proceedings of 11th IGLC Conference, Blacksburg, VA.

Ballard, G., Tommelein, L., Koskela, L. and Howell, G., 2002. “Lean Construction Tools and Techniques”, in Best, R., and De Valence, G (Eds): Design and Construction: Building in Value. Butterworth-Heinemann, Oxford, pp. 227-255.

Concerto case studies (http://www.realization.com/) (accessed 24th March 10)

Deming, W.E., 1982. Quality, Productivity and Competitive Position. Cambridge, MA: MIT Press.

Elton, J., Roe, J., 1998. “Bringing Discipline to Project Management”. Harvard Business Review, March-April, pp. 53-159.

Fiallo, C. and Revelo, V. (2002). “Applying LPS to a Construction Project: A Case Study in Quito, Equador”, Proceedings of the 10th IGLC Conference, Gramado, Brazil.

Fondahl, J., 1980. “Network Techniques for Project Planning, Scheduling and Control”, in: Frein, J. (Ed.), Handbook of Construction Management and Organisation, Van Nostrand Reinhold, NY, pp. 442-471.

Goldratt, E.M. (1990), The Haystack Syndrome: sifting information from a sea of data. North River Press, Cronton-on-Hudson, NY.

Goldratt, E.M., 1997. Critical Chain. North River Press, MA.

Goldratt, E.M., 2007. Viewer Notebook: The Goldratt Webcast Program on Project Management – the strategy and tactics tree for projects 4.7.1. Goldratt Group Publication.

Herroelen, W. and Leus, R. 2001. “On the merits and pitfalls of critical chain scheduling”, Journal of Operations Management, Vol. 19, pp. 559-577.

Hill, T., 1985. Manufacturing Strategy. London: Macmillan Education.

Hopp W.J., and Spearman, M.L., 2000. Factory Physics. 2nd Ed., Singapore: McGraw Hill.

Howell, G. (1999). “What is Lean Construction-1999”, Proceedings of 6th IGLC Conference, California, Berkeley, 26-28 July.

Junior, A., Scola, A., and Conte, A. (1998). “Last Planner as a Site Operations Tool”, Proceedings of the 6th IGLC Conference, Guaruja, Sao Paulo, Brazil.

Kim Y. and Jang J. (2005), “Case study: An application of Last Planner to heavy civil construction in Korea”, Proceedings of 13th IGLC conference, Sydney, Australia, July 2005.

Kishira, Y., and Ohara, S., 2005. “Implementation of P2M for Public Construction and Analysis of the Results”. Proceedings of PM FORUM, July/August.

Kostella, L and Ballard, G., 2006. “Should project management be based on theories of economics or production?” Building Research  and Information , Vol. 34, No. 2, pp. 154-163.

Koskenvesa, A. and Koskela, L. (2005). “Introducing Last Planner: Finnish Experiences”, Proceedings do the CIB Symposium, Helsinki, Finland.

Leach, L.P., 1999. “Critical Chain Project Management Improves Project Performance”, Project Management Journal, June, pp. 39-51.

Lechler, T.G., Ronen, B., Stohr, E.A., 2005. “Critical Chain: A new project management paradigm or old wine in new bottles?”,  Engineering Management Journal, Vol. 17, No.4, pp. 45-58.

LCI, 2001. Lean construction institute. http://www.leanconstruction.org/

Mossman A. (2007), An Introduction to Lean Construction and Last Planner, workshop manual, available at (http://www.leanconstruction.org/) (accessed 25th March 10)

Newbold, R.C., (1998). Project Management in the Fast Lane – applying the theory of constraints. St Lucie Press.

Ohno, T., (1988). The Toyota Production System; Beyond Large-Scale Production. Productivity Press, Portland, Origan.

Raz, T., Barnes, R., Dvir, D. (2003) “A Critical Look at Critical Chain Project Management”. Project Management Journal. Dec, pp. 24-32.

Skinner, W., (1974), “The Focused Factory”, Harvard Business Review, May-June, pp113-21.

Srinivasan, M.M., Best, W.D., and Chandrasekaran, S., (2007), “Warner Robins Air Logistics Centre Streamlines Aircraft Repair and Overhaul” Interfaces, Vol. 37, No. 1, pp. 7-21.

Steyn, H., (2000), “An Investigation into the Fundamentals of Critical Chain Project Scheduling”, International Journal of Project Management, Vol. 19, pp. 363-369.

Stratton, R., (2009). “Critical Chain Project Management – Theory and Practice”. Journal of Project Management and Systems Engineering, TOC Special Issue, Vol 4, pp. 149-173.

Thomassen, M., Sander, D., Barnes, K., and Nielsen, A. (2003), “Experience and results from implementing lean construction in a Large Danish contracting firm”, Proceedings of the 13th IGLC Conference, Virginia, USA.

Trietsch, D., (2005), “Why a Critical Path by Any Other Name Would Smell Less Sweet?” Project Management Journal, 36(1), 27-36.

Womack, J.P., Jones, D.T, and Roos, D., (1990), The Machine that Changed the World, Macmillan, NY.

All materials available on the TOCPA site are the intellectual property of their authors and cannot be reproduced in any other media and used for any purposes without the prior permission in writing of the authors.

6. TOC in Remanufacturing or Chasing Muda (John Darlington)

A Case Study in TOC and Lean Enterprise Application

This chapter belongs to a collection of vintage stories that are worth telling as they are still relevant for today as they were twenty and thirty years ago. The author brings here his experience of combining TOC, ST Point software (version of OPT) and Lean. The article covers experience of five years (1994-1998).

John Darlington photoJohn Darlington

John Darlington is a management consultant specialising in TOC & Lean applications applying the principles across the entire enterprise, from design to delivery.

John worked for AlliedSignal Turbochargers from 1986 – 1999. During this time, he held a variety of roles including Financial Director, IT Manager and Plant Manager. John is qualified in TOC, Lean, Six Sigma and Kaizen. John led the systematic introduction of Improvement methodologies across many sites with particular emphasis on practical application to improve bottom line performance.

johndarlington@me.com


I learnt about TOC first and came across Lean later; I am happy about that piece of serendipity.

Background

The business is in the automotive industry and we offer remanufactured and non-current production turbochargers and parts to Original Equipment Manufacturers (OEM) and Independent Aftermarket (IAM) customers.

Remanufacturing, as it is more commonly known helps minimise waste by giving products extended life cycles and uses only a fraction of the energy and resources associated with creating new products.

It is worth explaining at this point some of the characteristics of Remanufacturing for those who have not come across it before.

Profitability

Old units as yet unprocessed awaiting remanufacture are called”old core”.

Remanufactured units, in our case turbochargers, generally speaking become a market requirement after a few years of service when warranty periods have expired and when the age of the vehicle means that the owner is perhaps looking for a less costly alternative to buying a new replacement unit.

One way or another remanufactured unit are a cheaper alternative to new units.
This difference can be achieved in a number of ways including sell price discount, payment for the returned “old core”, or some sort of credit scheme. But the effect is the same; the remanufacturer does not get as much sell price for the remanufactured unit as they do for a new one.

This being the case the incentive to enter the business is to collect the “old core” cheaply enough and to engage in the remanufacture process economically enough with good quality so that the sell price gap is closed by more favourable material costs.

In our instance most of the “old core” was returned at a nominal cost, and once accepted on their return it signalled that we would promise to sell a similar unit to the customer in the future at a reduced sell price.

So the basic profit equation was determined by the amount we could successfully salvage out of the “old core” and the timeliness and cost of the remanufacture process.

The Process: Figure 1

Fig 1

The “old core” returned is inspected on receipt for identification but has to be disassembled to component parts to judge if it is suitable for the remanufacture process.

Most scrap from “old core” occurs just after disassembly

Following disassembly the surviving components are washed to degrease them and then shot blasted. This is the next highest point of scrap material as deformities, too small to detect when the products are dirty, are revealed when clean.

After cleaning the components go their separate ways for processing.

Apart from a grinding operation on a rotating sub assembly the remanufacture of the turbocharger components was not so difficult technically.

Demand and Planning

The logistics are relatively complex in remanufacturing. The sources of that complexity are: –

• Promising to maintain supply for maybe 20 years after current production status.

• Some customers send in old core “A” but asks for remanufactured unit “B” in exchange or perhaps they have no “old core” at all. In this instance they may have to pay a premium price.

• Despite that premium there is still the issue of trying to source new material for what could be a very old model.

• The sheer volume of part numbers as products tend to be innovated or superseded with cheaper or better quality component materials.

• There can be multiple bills of materials because of alternatives.

• “Old core” may not be available on time.

• Component salvage rates are unpredictable in the short term, as each turbocharger will have experienced different levels of maintenance when in service. See Figure 1.

Early Days

In early 1994 we understood that remanufactured parts were theoretically about one third of the cost of new components. Theoretically because only sum we had any confidence in for comparative purposes was that the total cost of running remanufacturing operations was cheaper than the purchase price for the components we managed to salvage but would have had to have bought new if it were not for successful remanufacturing.

Obviously this “sum” was highly volatile in the short term; for instance during a week if a particular set of turbochargers had experienced a “hard life” then our salvage rates deteriorated and the expensive new components would have to be sourced as alternatives. And in this instance we would still have the operating expense of remanufacture.

Our conclusion was that we could only judge the impact of Remanufacture in the longer term and that individual product margin analysis was flawed because there were too many variables in the mix of old and new components.

So the only way to achieve the profitability of the whole was to ensure a lot of good remanufactured components were contained within the remanufactured whole turbo.

Unfortunately at the time in 1993 and early 1994 remanufactured turbochargers contained predominantly new material and the impact of that are evident from our overall performance which was weakening.

Table 1

By way of explanation, the volume of assemblies was up by some 20% in 1994 over 1993 which was good but the fact was we were singularly poor at remanufacturing and this resulted in our using too many new and more expensive components in the builds.

And our operating expenses increased. Result; misery

It should be noted from an accounting point of view that no remanufactured components were given any standard cost until they had successfully come through the process. The transaction of inventory valuation and cost recovery was made as the remanufactured component was located in the warehouse store.

This was an important point for what we found in 1994 was that short term profit targets drove poor behaviour through remanufacturing rather than attention to customer value and that flow.

The only target was to recover costs which led to an enormous amount of aluminium components being released for remanufacture whether they were required or not as they enjoyed a 90% plus salvage rate and you could be pretty certain they would survive the process.

Components moved in batches dictated by large containers or “skips” and the inclination was to batch further to reduce set up times.

The MRP system was able to hold alternative component information and allow access to a material planner who had no material available of the primary part number in the bill of materials. However the material planner had to take an active step to allocate the alternative material; another non-value adding transaction and another delay of information.

Further the MRP system was hampering assembly by its inability to split or overlap order quantities to get material flowing.

The People

The people were not the problem. Quite the reverse in fact as without their effort things could have been a lot worse.
However as elsewhere in the Plant the operators and supervisors of remanufacturing were subject to quite a traditional organisation structure.
The remanufacturing part of the business had only been added in 1992. Prior to this it was conducted at a French facility. To accommodate remanufacturing an additional unit of space was leased on the end of the current factory.

However remanufacturing remained segregated physically by a dividing wall and mentally because it was so different to the more usual activities performed in the plant before the 1992 change.

There were approximately 48000 part numbers and which it appeared to me the material planners knew “off by heart”. They used this information informally to adjust assembly schedules and make requests on production for priorities.

Conclusion…Double Jeopardy

It was the conclusion of most people that the poor performances in terms of sales, profit and customer service were directly traceable to the start up of remanufacturing.

An inability to synchronise those efforts put added pressure on supply of new material for if remanufactured components were not available when assembly came to build a remanufactured turbo then new material components had to be used.

If those new components had originally been recruited to fulfil a demand for an order for new parts or turbos then the remanufactured shortage exerted a double impact.

TOC Priority and Kaizen Activity

We needed to improve Planning, People, and Processes

The following three tables note the major changes over the period from mid 1994 to the end of 1998

Planning

The planning issues revolved around three fundamental questions: –

1. What is it that I should order as new material recognising that we will not get 100% of parts salvaged?

2. How much “old core” material should I release into the remanufacturing process?

3. What quantities of good remanufactured parts shall I call for to re assemble the whole thing?

Table 2

A common solution to the problem of salvage is the idea to split the BOM to reflect the expectation of remanufacture salvage rate and new. (See Figure 1)

Some companies then alter these ratios on a regular basis to reflect changes to process or simply to update to their latest experience of salvage rates.

In some respects we liked this countermeasure as it would ensure that we were ordering the right quantity of new parts as far as anyone could tell and it would be done systematically rather than rely upon a material planner’s good effort.

It would call for a ratio of parts to be processed through remanufacturing which reflected the expectation of salvage and would be synchronised with the arrival of new material.
It offered the expectation that when we came to rebuild it in final assembly a historically accurate call off would be made of new and remanufactured components.

We decided to adopt these practices and set the product engineers off making the necessary adjustments to the BOM whilst a small team implemented a finite scheduler called ST Point as our new logistical tool. By way of explanation ST Point was a derivative of OPT designed primarily by Issachar Pazgal…. All TOC devotees should look that name up :).

It is important to note we did not need ST Point for capacity planning or detailed scheduling in the conventional sense. Our number 1 constraint was how to make the best use of raw materials.

The first model the team built in ST Point was based upon assembly demand and we indicated to the scheduler that demand for remanufactured components could be fulfilled by a supplier called Reman. Clearly this was our own remanufacturing plant which now received a schedule once a week at first.

Unlike the previous system, which simply tried to keep value high for accounting “credits”, we had now established what part numbers were actually required at component level and in what quantities. New material was similarly synchronised to make up the balance of the demand requirement.

Throughout 1995 ST Point released inventory in a much-improved manner over MRP for both new and remanufactured turbochargers. Our inventories fell substantially as you might expect but once the excessive buffers had been consumed after maybe 6-8 months then we were confronted by us how poor our suppliers were at delivering on time.

The suppliers became the limiting factor for an extended period and caused us to “flatten out” in terms of Performance as can be seen above in terms of Sales Units assembled and Inventory in Table 1 during 1995-1996

Finally we got Group agreement to launch a plan to develop our own supply base for non-core components. This was a long hard process worthy of its own story but suffice to say the Purchasing Manager was an inspiration in terms of hard work and determination.

Realistically we knew that we would not see a significant change in the supply situation until the final quarter of 1996. You can commence resourcing supply of components as quickly as you like but appointing new suppliers takes time
However considering we were often so short of new parts we looked to make better use of the several thousand “old cores” which were awaiting a call off for disassembly. These old turbochargers did not always match the total requirement of demand but did contain many useful parts that we could not obtain easily as new.

Although this appeared on the surface to be condoning over production, possible the worst form of waste, we had to try to increase the usage of remanufactured parts and take the pressure off new recruitment at least until our new suppliers kicked-in. This was achieved by introducing a FIFO method of old core disassembly.

At the same time we utilised ST POINTS ability to handle “chained alternative” material information automatically. This did away with the need to describe and update the salvage rates to the system.

Where the MRP system through the BOM had established a relationship of 70% remanufacture and 30% new and in reality the ratios had come out at 60% remanufacture and 40% new then MRP required a material planner’s intervention.

ST Point established a linked chain of alternative part numbers and having done so would check availability of each one to fulfil an order.

If there was a sufficient quantity of the first part number in the chain it went no further. If there is none or insufficient it went automatically to successive alternatives until the order is satisfied.

Component Chain                           Turbo Chain
Reman A to Reman B                     Turbo A to Turbo B
Reman B to Reman                         Turbo B to Turbo C
Reman C to New B                           Turbo C to Turbo D
New B to New C
New C to New A
• Order new components driven by ST POINT (100%)
• Re-assemble using any combination of remanufactured and new parts via chains

By 1998 our environment had changed again. Against a backdrop of very high demand for new assemblies, transferred from another part of the group, space became a constraint.

We examined the amount of remanufactured product we were storing in respect of the FIFO policy of disassembly and concluded we could reduce it significantly. In addition the reason for introducing the policy had been to gain time whilst our new supply base was introduced. This was a more mature process by 1998 so we could afford to change.

New and good remanufactured parts were stored in our Warehouse awaiting a signal that they were required for assembly. By using a time horizon of just one-week we allowed ST Point to choose parts for assembly.

Using the “chained alternatives” its priorities would be to try finding remanufactured parts but if they were not available use new parts. Sometimes it would find neither remanufactured nor new components and highlight a shortage.

ST Point would then check the turbocharger that was creating the shortage and add that to a second scheduling pass. In the second pass we looked at demand in assembly for the second week but did not allow ST Point to see any components in the Warehouse at all.

In the absence of any components ST Point would pick the “old core” to be disassembled to match the demand for new assemblies.
These had to be completed in week 1 so that when an assembly schedule was to be created for week two, components were then available in the Warehouse.
And so the cycle would continue.

The ST POINT and the “2 x Pass Solution”
Fig 2

text after fig 2

People

Table 3

We knew we had a good workforce and in 1994/95 we took active steps by team working activity and TQ problem solving tools to motivate and encourage them to test their solutions.

We examined our processes and where we believed we had a core process we took steps to invest in capital and training to enhance our ability to master it.

The Human Resources Manager developed what is known as High Performance Work Teams. That is we extended the general team working and cross-functional problem solving of our TQ training into specific training for natural work teams.

Together with this we assigned each team member a role. The size of our plant and consequent teams lent itself to this activity so that each member had an active role to play.
To train them in these roles we used the Kaizen Institute in a “train the trainer” exercise in which two local employees learnt the Kaizen teaching to roll it out in the rest of the plant later.

As the objective was to tap into the inherent understanding of the operators and to get closer to their issues, which is where the real value added lies in a factory, we reduced the number of layers between plant manager and operator.

A major test of the success of this training was the re-layout of the Remanufacture area.
Assisted by the Kaizen Institute it became a major participative event and with policies and rules established regarding 5”s”, Visual Management, and HS&E considerations, team representatives fed back to their teams so that they could highlight concerns and have a say in their own cell construction.
The re-layout was such a success we managed to free sufficient space to bring goods receiving into the main plant, reduce the distance travelled by parts by several hundred metres. Also to divest ourselves of another facility we owned some 30 miles away.

By 1998 our environment had changed again and after something of a breakthrough in our logistical planning we reverted to Demand Led Remanufacture from FIFO

Processes

Table 4

As a key issue in turbocharging is the speed at which the turbo spins, sometimes exceeding180, 000 revolutions per minute, balancing those rotating parts is a key skill.

Thus we looked to bring grinding and balancing sub assembly rotating operations in house and further invest in final assembly balancing capability which we defined as a constraint or occasionally bottleneck resource considering our backlog orders and a heavily constrained resource for normal demand.

Other core processes were analysed and the re layouts already described made the processes more close knit reducing the need for information flow.

Conclusions

Five years is a long period to review in any case study so this conclusion must be abbreviated to the pertinent points.

The main breakthrough events were TOC driven via improved planning. However it would be wrong not to comment on the spirit of the workforce and how their smaller stepped improvement complemented the bigger picture.

The author spent 5 happy years as plant manager or 60 month ends :).

Although I would argue it was successful in terms of profit and Inventory turns, it was less so in relation to customer service.

The down side was that the growth that we enjoyed and which was so helpful in allowing us to reward removal of waste by employment in a more value adding capacity meant we experienced almost constant new component shortages as suppliers struggled to keep up. This translated into delays to customer orders.

Profit, both in absolute terms and as a % of sales, grew tremendously in the years from 1994 to 1997. After this time the transferred business changed sales mix so fundamentally that a comparison is difficult. However total profit has continued to grow.

How?

• ST POINT enabled better synchronisation leading to output increases of over 250% whilst only 16% more operators were introduced.
• Physical floor space reduced by 25%.
• Inventory turns increased more than fourfold.
• Simplification of “spaghetti” production and introduction of “U” shaped cells reduced distance travelled by over 500 metres.
• The same “simplification” of the flow increased the communication between operators making it easier to work by visual means and engaged their imagination and efforts to “flow” material.
• The introduction and pursuit of empowered natural work teams generated more improvement ideas than we could have dreamed possible in 1994.
• In remanufacturing with STPOINT focussing us closer on “true” demand more than double the output was produced by almost half the number of employees compared with the starting position.

Acknowledgements

Oded Cohen

Kate Mackle Kaizen Institute Europe

David Howells Director Renault Institute of Quality Management

David Blacklock Scheduling Technology Group

Harvey Ball and Kendall


All materials available on the TOCPA site are the intellectual property of their authors and cannot be reproduced in any other media and used for any purposes without the prior permission in writing of the authors.

5. Project management in a hospital: From chaos to success (Hans Steenpoorte and Michel Stijlen)

Maasstad Hospital in Rotterdam, The Netherland, doubled the number of successfully completed projects in half the time using Critical Chain Project Management (CCPM)

Hans Steenpoorte and Michel Stijlen, Project leaders, TOC Resultants, The Netherlands


Hans Steenpoorte 

TOC implementer in service organizations, government, professional services, IT and healthcare. In 2006 completed Goldratt Schools Application Expert Program.   Co-founder of Critical Task Manager (CTM) –  TOC-based software for service organizations.

h.steenpoorte@toc-resultants.com

www.toc-resultants.com


Michel Stijlen 

TOC implementer in service organizations, government, professional services, IT and healthcare. Co-founder of Critical Task Manager (CTM) –  TOC-based software for service organizations.

m.stijlen@toc-resultants.com

www.toc-resultants.com


The article was written in October 2010

At Maasstad Hospital in Rotterdam many projects were running at the same time. Projects that were necessary to realize the ambitions of the hospital. The problem was that too many projects yielded too little result too late. Maasstad Hospital implemented Critical Chain Project Management (CCPM) and cut the average lead time in half whilst doubling the number of completed projects …… with the same number of people! Now, CCPM is an indispensable tool for innovation at the hospital.

Background
At first glance, Maasstad Hospital Rotterdam is just another hospital. In 2005, it ran into financial trouble and had to restructure completely. Since then, Maasstad Hospital has made a strong come back. It grows faster than the market and is financially healthy again. So healthy, that it confidently invested in a new hospital that it just moved into in spring 2011.

In early 2008, the recovery was in full swing and one of the problems that the management and its employees ran into was the long lead times and poor delivery performance of many projects. A survey by hospital staff led to a shocking conclusion: There were no less than one hundred eighty projects running simultaneously, and a significant number of them had no clear project leader, sponsor, scope definition, budget or due date. The Chief Innovation Officer of Maasstad Hospital explains: “Projects, and a lot of them, are inevitable for a hospital with our ambition level. But we had insufficient visibility and control over project selection, progress and completion.”

Following this sobering observation, the hospital’s board decided to invest in a project management solution that not only had to create order in the projects, but would also raise its output. They chose Critical Chain Project Management (CCPM) because it had amply proven to improve both output and due date performance of projects without increasing workload (see insert for more information about CCPM).

CCPM: Clear task priorities for outstanding project performance
Critical Chain Project Management (CCPM) was developed by Dr. Eli Goldratt, author of The Goal and Critical Chain and founder of the Theory of Constraints (TOC). CCPM is the solution for project organizations that have a low project performance in time, scope and budget.

CCPM uses the fact that project plans have more slack (“buffers”) than project teams know or want to admit: These buffers are their only means to achieve acceptable delivery performance. Or so they think …..

During project planning, CCPM takes these buffers from the task estimates and insert them in a project buffer at the end of the project. After all, it is not important for individual tasks to be completed on time, as long as the overall project is finished on time.

Figure 1: CCPM: The project, instead of its tasks, is protected by a time buffer

During execution, tasks that need to be executed now are regularly updated in the CCPM software by means of a remaining duration estimates: How many days till this task is completed? This estimate is then used to calculate which task consumes most of the buffer. Based on this ‘buffer consumption’ clear task priorities are calculated and depicted as green, yellow or red tasks.

Figure 2: Colours give clear priorities within and between projects

These clear task priorities within and between projects not only end frequent discussions about project priorities, but also result in a faster and more reliable completion of projects.
Typical CCPM implementations result in the following improvements:
• Due date performance ≥ 90%
• Lead time ≈ 30% shorter
• Productivity ≈ 30% higher
• Less stress and more focus in project teams and management
CCPM has been successfully applied on a large scale in industry, IT, pharma, infrastructure & utilities. Insofar as the authors can ascertain, this application in a hospital is a first.

Yet another project
In June 2008, yet another project commenced: “Implementation of CCPM”. But the goal of this particular project was to significantly reduce the number of concurrently active projects by the end of 2009, whilst assuring that 95% of the projects are finished on time, scope (what you deliver) and budget. It was decided to focus the implementation on cross-departmental projects which caused the bulk of the load and problems at project resources in Maasstad Hospital.

To start with, the project team made an inventory of problems and discovered that they were deep rooted and fundamental:
• Some of the projects had no plan
• Some of the projects had no clear project leader or sponsor
• Projects were launched, regardless of the availability of the required staff
• Management had insufficient understanding of problems and status of active projects
• Projects were often completed too late (if a due date was set at all)
• Project group meetings were sometimes ineffective
• Projects often went over budget (if there was a formal budget)
• Project staff were not always available when needed
• There was tension and debate on priorities within and between projects
This survey also revealed that Maasstad Hospital first had to invest in basic elements of project management, in order to be ready for the implementation of CCPM.

Basic elements of project management
In a high performing project environment, every organization needs three things: structures, processes and templates.

Structures: Projects are temporary endeavours to achieve something unique. So, even more than with regular work, it is important to clearly identify roles and responsibilities. Obviously, the project leader is critical because he is responsible for the delivery of the scope (what you deliver), on time and within budget, but the sponsor also plays a key role. Each project must have a sponsor which is decisive and accessible for the project leader. The sponsor is often problem owner, provider of the necessary budget and the person who needs to approve potential deviations from the plan. Appointing decisive and accessible sponsors and assuring frequent and constructive consultation between project leader and sponsor was an important first step to success at Maasstad Hospital.

Processes: Since projects are unique, most develop, almost by definition, in a fairly unpredictable way. For this reason, it is important that key processes are in place to deal with these unforeseen developments. First, we established that projects are always in one of the following 4 phases: idea, planning, implementation and evaluation. The transition between each phase is a formal step that requires a decision by the client or the project board (see below). In order to maintain progress in active projects, brief weekly project meetings and monthly meetings with the sponsor proved critical to success.

Templates: Project management has become notorious for demanding extensive project plans that proved quite useless during execution. Hence CCPM provides plans and reports that are very concise and focused. Maasstad Hospital in Rotterdam, introduced no fewer than six templates for project ideas, project plans, project meeting notes, project status reporting, escalation, and completion reports. At first, some of these templates received some skepticism, but now they are all used extensively because they help project teams and sponsors to focus and save time.

Project Board
Besides implementing structures, processes and templates a so called Project Board was set up. The Project Board is a tightly structured meeting of the hospital’s board that included all sponsors of the  cross-departmental projects. The objective of the project board is threefold: First, selection of valuable project ideas. Second, ensure effective intervention by sponsors in struggling (so called “red”) projects, and finally evaluation of completed projects.

Figure 3: Transparancy about active projects and their status; green, yellow or red

At Maaststad Hospital project selection was simplified by means of a 1 page form that the author needed to discuss with a potential sponsor before proposing it to the Project Board. The Chairman of the Board then lead the discussion: “In no more than fifteen minutes, we often have five or more project ideas to discuss. I ask only three questions: Who is excited about this idea? What problem does it solve? And: What is the direction of the solution? Through question 1 and 2 we lost quite a few ideas, and normally only 1 or 2 get approved for planning, provided that at least 2 projects were completed as well. Otherwise they must wait to prevent overloading of the project resources. “

The advantage of this method is twofold. Firstly, management now is fully aware of, and committed to, all ongoing cross-departmental projects. But more importantly: During the first phase of implementation significantly less projects were started, thus reducing the work load on the scarce project resources and allowing them to focus on finishing already running projects effectively.

Besides focusing on project selection, execution and evaluation the project board also monitors the depletion of the project budget. In many organizations, projects need to be financed from departmental budgets, often leading to heated discussions at the end of the year when the overall budget appears to have been exceeded. To stop this once and for all, Maasstad Hospital took a fraction of all relevant operating budgets and inserted them into one central project budget, aimed at covering the out of pocket expenses of all cross-departmental projects. Every month, the project board monitored the real and expected exhaustion of this budget vs time using a simple report. This way the project board could monitor the budget depletion per project, but more importantly found that the inevitable budget overruns and under spends tend to offset one another provided they are financed for a single source; the cross-departmental project budget.

Finally CCPM ……
In the fall of 2008, the situation in Maasstad Hospital had significantly improved: All the projects had clear project leaders, sponsors and consensus over time (due date), scope (what they will deliver), budget (out of pocket expenses only) and goal (desired outcome). Because the project board was quite reluctant to approve new projects and even some struggling projects were stopped, the pressure on the project resources declined. It was time to introduce CCPM to further reduce lead times and increase completion.

Software can never be the aim of an improvement project, but, increasingly, it is becoming a necessary precondition. CCPM software distinguishes itself from other project management software in the sense that it is focused on execution rather than planning. After all, it is during execution that the project almost inevitably starts to deviate from the plan and more often than not, in traditional project management the plan is abandoned altogether. The solution is a robust high level plan that doesn’t detail actions, but lists deliverables, intermediate objectives necessary for achieving the project objective. Plans usually consist of no more than ten to fifteen deliverables. During execution the responsible resource can add actions to the deliverable that are deemed necessary to generate the desired outcome.

Project plans are not created by a person sitting at a computer. One of the key success factors of this CCPM implementation is the so called planning session: After approval of the project idea by the Project Board, the proposed project team gets together for a four hour meeting. In a closely facilitated meeting they go through the key elements of the project plan template in such a way, that the draft plan is filled in and ready to be sent to the sponsor for approval by the end of the meeting. At Maasstad Hospital projects are no longer started without such a planning session. In very little time it generates a focused plan with maximum buy-in that contains all elements the project team needs to execute the project successfully.

Once a project is in progress, frequent (weekly) short project team meetings are critical for success. In the weekly meetings, the project leader updates the project real time in the CCPM software, based on the input of the team members. Maasstad Hospital has even invested in a number of “CCPM-rooms” with computer and flatscreen TV’s on the wall where project teams can meet and update their project.

What is unique about this? CCPM makes very clear which project deliverables need to be worked on now and in what order of priority both and between projects. This leads to calm and focus as well as a better flow of projects. Per active deliverable, the tasks are updated by entering the estimated number of days until completion. CCPM is always forward looking: Do not spend time on what has been done, but focus on what needs to be done to finish a deliverable. And even more importantly, avoid blame if tasks were completed late. Accept windfalls and setbacks as a fact of life in a project environment and focus continually on corrective actions and decisions that lead to completion of the project on time, scope and budget.

Through the CCPM implementation, Maasstad Hospital learnt that project management is a vital but often underestimated craft. For that reason, it secured the continuation and development of CCPM knowledge in an in-house project office. The project office provides training courses for project teams and leaders, facilitates planning sessions, prepares project board meetings and gives (un)solicited assistance to projects that are in red.

Results: Doubling the output and halving the lead time
Between late 2008 and spring 2009, all the old projects were finished and new projects under CCPM principles introduced. Due to its success, the management has decided to add a group of existing projects related to the construction of the new hospital to the CCPM portfolio (see the increase in the summer of 2009 in Figure 4 below). Nevertheless, the number of cross-departmental projects that ran simultaneously in Maasstad Hospital remained fairly stable with approximately 30, versus over 40 at the start in mid 2008. This decrease is critical to the focus of project resources and the flow of projects.

Figure 4: Number of concurrent cross-departmental projects declined from around 40 to under 30 despite growing the portfolio

The fact that Maasstad Hospital could add a significant number of projects to its portfolio was due to the fact that they finished much faster than before. Figure 5 shows that the average lead time of cross-departmental projects has decreased from over 2 years in 2008 to approximately 10 months in 2009 and 2010. This is less than half the lead time!

Figure 5: Average lead time (in # of months) of cross-departmental projects was cut in less than half

This brings us to the last and most important achievement: In 2008, on average 1 cross-departmental project was finished per month. The Chairman of the Board concludes: “By introducing project management principles and CCPM, the productivity of our project resources nearly tripled. Currently we finish about 3 cross-departmental projects per month. Project management has become a core competency of Maasstad Hospital towards achieving our ambition; making Rotterdam the healthiest city in the Netherlands.”

Figure 6: Number of projects finished per month tripled (6-month rolling average)

Lessons for successful implementation
Maasstad Hospital Rotterdam had too many projects that often ran late and yielded too little result. CCPM has been implemented, resulting in doubling the speed of delivery and a tripling the number of completed projects.
What is critical to achieving success?
1. Implement simple structures, processes and templates for all projects
2. Install a Project Board at board level to select projects and evaluate and monitor progress
3. Create a central budget for all out of pocket expenses and avoid planning and monitoring of internal hours
4. CCPM project management is a craft: Use an experienced implementer and retain the knowledge and skills in a project office
5. Accept windfalls and setbacks as a “fact of life” and keep project teams focused on completing projects on time, scope and budget

Learn more about project management and CCPM:

– Goldratt, Eliyahu M., Critical Chain

– Nokes, Major, Greenwood, Allen, Goodman, The Definitive Guide to Project Management, Prentice Hall- Financial Times

– www.realization.com

– www.toc-resultants.com

All materials available on the TOCPA site are the intellectual property of their authors and cannot be reproduced in any other media and used for any purposes without the prior permission in writing of the authors.

4. Whatever We Do or Say Is for a Purpose: The Role of Communications in Change Management. Part 2 (Jelena Fedurko)

Jelena Fedurko

Jelena Fedurko has been transferring and developing TOC knowledge, supporting TOC implementations in operations, distribution, project management, marketing and sales and people management since 1999. She has worked in more than 15 countries.

Jelena is a Co-Founder and Co-President of TOC Practitioners Alliance TOCPA, International Director of TOC Strategic Solutions and a TOC Expert in tocExpert. Jelena is an author of several books on TOC Thinking Processes and TOC Basics, as well as many articles and publications.

jelenafedurko.gs@gmail.com      www.tocexpert.com


We continue publishing Jelena Fedurko’s article Whatever We Do or Say Is for a Purpose: The Role of Communications in Change Management. Part 1 of this article – presented in Chapter 3 – looks at the type of changes that TOC brings into organizations through the prism of understanding and interpreting peoples’ behavior.  It demonstrates how to build change-related messages so as to adjust them to the specific communication patterns of the people we need to win and involve in the change.

Part 1 gives guidelines and presents examples of 6 communication patterns developed by Rodger Bailey (1986) as the Language and Behaviour (LAB) Profile:

  • Motivation direction – Toward/Away From
  • Motivation source – Internal/External
  • Reasoning process – Options/Procedures

Part 2

In the course of a TOC implementation, a TOC leader should also transfer the relevant knowledge about the TOC solution, terminology and tools to the team and resources.  There is a need to establish common concepts and common language and ensure that people understand what is meant by the major TOC terms.  It will be necessary that they accept and use this terminology on the everyday basis.

I suggest using the communication patterns Toward/Away From, Internal/External, and Options/Procedures  while communicating the major TOC tools:

1. The U-Shape

2. The Cloud

3. The Negative Branch Reservation (NBR)

4. The Injection

1. How to communicate the U-Shape

Figure 9: The U-Shape[1]

The U-shape is the concept of organizing TOC knowledge in a comprehensive logical diagram.  It describes TOC entities that participate in the analysis of the current reality, and the construction or usage of the solution to create an improved future reality.  It allows organizing, storing and easily retrieving the TOC knowledge.  The U-shape is used for generic TOC solutions such as MTO, MTA, CCPM, and Distribution, as well as for developing marketing offers.  The U-shape concept is valid for developing and understanding any solution[2].

2. How to communicate the Cloud

Eng Ch4_fig 10_communicating cloud

Figure 10: The Cloud

Eng Ch4_fig 11_communicating cloud - table

3. How to communicate the Negative Branch Reservation (NBR)

Figure 11: The NBR

4. How to communicating the injection

Figure 12: The Injection Flower[3]

For every Injection the implementation team should: learn its essence and structure, check that the Injection will address the relevant UDEs, bring the DEs, and not cause any significant NBRs.  For every Injection the team should build the implementation plan and develop the procedures.

The role of the TOC leader is to encourage and support the implementation team in doing this work.

Relevant TOC tools and knowledge for communication in the change implementation process

There are two major stages in the change implementation process: pre-decision and post-decision.

The pre-decision stage has the following phases:

Figure 13: The pre-decision stage

The pre-decision stage is crucial. The change initiator must get the support of decision-makers – owners, top managers, key specialists, and financial institutions that will decide whether to provide financing.   In this stage, the major challenge lies in energizing everyone who will influence the change-related decision to the ‘I want THAT’ state.

For that, the change initiator must know how to persuade the relevant people to go for change and, more specifically, the change that s/he is pursuing.  To achieve that, s/he should do the proper “homework” in order to:

  • have a clear answer to the question ‘Since the change is meant to be the solution, what problem will it remove?’;
  • have a good knowledge of the change content and mechanics;
  • define well-formulated deliverables in terms of benefits for the organization and individuals;
  • be prepared for criticism or change resistance, thinking before and what the reservations and concerns of the relevant people might be and how to address them;
  • be able to identify the layers of resistance and handle them through the TOC tools;
  • be able to understand the motivation and thinking patterns of communication partners, and respond through appropriate persuasive messages.

In the pre-decision phase the change initiator will need to lead the relevant people through the TOC process of agreement on the change (overcoming the layers of resistance that we discussed before):

  1. Reaching agreement on the problem.
  2. Reaching agreement on the direction of the solution (the suggested change).
  3. Reaching agreement that the change will bring tangible benefits.
  4. Reaching agreement that the change will not bring negative side effects.
  5. Reaching agreement that the change is “doable” – that all known obstacles can we removed.

Let’s see how it manifests itself after the change is suggested, and leads to a positive decision putting the organization on the journey to embrace the change.

Figure 14:  The TOC tools and knowledge to be applied in the process for reaching agreement in the pre-decision stage

It is important to note that for all practical purposes the sequence of the first three steps of the process for reaching the agreement can be different:

  •  step 1, then step 2, then step 3, or
  •  step 3, then step1, then step 2, or
  •  step 3, then step 2, then step1.

The sequence would be determined to a great extent by the motivation direction patterns – Toward or Away From – that we detect from the language people use when we communicate to them.  While starting with the problem is suitable for the Away From people, it does not make much sense to start persuading the Toward people with presenting them the problem that should be avoided.  Toward people are energized by the possibility to get, gain, achieve.  Therefore, talking to them it makes perfect sense to start with the benefits that the solution will bring, and then present the direction of the solution as the means to gain the benefits, and the problem as the justification for the need of the solution.

When our effort of persuading the relevant people to accept the change results in their positive decision, the new stage starts.  After the decision about bringing in the change has been made, the time for the debates whether to implement it or not is over!  Now it is time to take actions to make the change happen. We are moving to the stage of bringing resources to support the decision of the management and implement the change in their areas of responsibility.


Figure 15: The phases of the post-decision stage – after the decision to implement the change has been made

I presented the challenges of the post-decision stage, the emotions and behaviour of people, as well as the recommended detailed procedures to ease the pre-implementation and implementation phases in the article Practical Aspects of Implementing Critical Chain Project Management, included in the Goldratt Schools book on CCPM[4].

Here I would like to suggest relevant TOC knowledge and tools to reach agreement in each phase of the post-decision stage.

Pre-Implementation

This phase contains:

  1. Determining the content and scope of change
  2. Clear understanding of current processes
  3. Determining the list of  new procedures and identifying which current processes they will remove or change
  4. Developing first necessary procedures to start the implementation
  5. Developing the implementation plan
  6. Getting approval by the top management
  7. Internal training

The better the preparation in this phase, the higher are the chances of implementation success.  A very important part of the preparation is getting full support from all top management and the implementation team.

Figure 16: The TOC tools and knowledge to apply for gaining support in the pre-implementation stage

Implementation roll-out

This phase contains:

  1. Executing the implementation plan
  2. Developing and implementing procedures
  3. Monitoring, analyzing and adjusting procedures
  4. Working with people to get their collaboration

In this phase, the implementation unfolds in a staggered way that involves more and more areas of the organization.  Some of the people already have the positive experience that the first injections produce quick and tangible results.  The major task is to maintain their enthusiasm and encourage them to keep going.  At the same time, new people start to be involved in the implementation.  Their reservations and concerns need to be addressed.  Also, when we start the implementation, we are bound to have some unexpected difficulties.  We may discover that some part of the plan developed in the pre-implementation phase is not working and needs to be adjusted.  This phase requires a lot of attention and encouragement of the resources from top management and key implementation people.   Please note that in the steps of the TOC process of removing resistance, we are changing the emphasis from reaching agreement to reinforcing
and bringing evidence.

Figure 17: The TOC tools and knowledge to apply for gaining support in the implementation roll-out stage

Completing roll-out and moving to full execution

This is the phase in which the organization gets confidence that the solution is working.  The activities are in the right direction.  It is safe and beneficial to move from the trial or limited implementation to the execution of the solution throughout the whole department or the whole organization.

This phase contains:
Finalizing and formalizing procedures and documentation

  1. Ensuring adherence to the procedures throughout the involved department
  2. Ensuring top management involvement on routine basis

In the previous phase, we were monitoring and checking that the effort put in at the start of the implementation would deliver expected desired effects and were taking corrective actions when required.  In this stage, the main emphasis is on creating full awareness in the organization that that the change brings tangible benefits.

Figure 18: The TOC tools and knowledge to apply for gaining support in the full execution stage

Change management is challenging.  In every phase, we should put conscious effort into maintaining honest, disciplined and responsible communication to our people.

Afterword

This article contains recommendations and guidelines organized in tables and diagrams.  The presented approaches may seem too technical.  They require conscious analysis of people’s behaviour and language, and high thinking discipline and concentration for building appropriate messages. I was once asked, “How can one listen, analyze and respond, all at the same time and in the course of the real-time conversation?’  I would say, the same as we drive. It takes time when we learn, but the more we drive, the quicker we learn to do the right things.  After enough hours or days or months of practice, our body starts doing all the right moves automatically.

Being in communication is like driving at high speed on a busy road. We need to constantly monitor and assess the situation, recognize the signals from other traffic participants, and understand what they are doing or intend to do.  That is, if we want to get to our destination without a crash.


[1] Oded Cohen, Ever Improve: A Guide to Managing Production the TOC Way, TOC Strategic Solutions, 2010; presented with permission by the author.

Author’s remark: UDE – Undesirable Effect; NBR – Negative Branch Reservation; DE – Desired Effect

[2] Definition by the U-Shape author, Oded Cohen

[3] Oded Cohen, Ever Improve: A Guide to Managing Production the TOC Way,

TOC Strategic Solutions, 2010; presented with permission by the author.

[4] Project Management the TOC Way, Chinese Goldratt Alliance, 2009

This article was first published in the Goldratt Schools book Leading People Through Change, 2011, published by TOC Strategic Solutions


All materials available on the TOCPA site are the intellectual property of their authors and cannot be reproduced in any other media and used for any purposes without the prior permission in writing of the authors.

3. Whatever We Do or Say Is for a Purpose: The Role of Communications in Change Management. Part 1 (Jelena Fedurko)

Jelena Fedurko

Jelena Fedurko has been transferring and developing TOC knowledge, supporting TOC implementations in operations, distribution, project management, marketing and sales and people management since 1999. She has worked in more than 15 countries.

Jelena is a Co-Founder and Co-President of TOC Practitioners Alliance TOCPA, International Director of TOC Strategic Solutions and a TOC Expert in tocExpert. Jelena is an author of several books on TOC Thinking Processes and TOC Basics, as well as many articles and publications.

jelenafedurko.gs@gmail.com      www.tocexpert.com


Part 1

The meaning of the communication is the response that you get.

Joseph O’Connor and John Seymour

ABSTRACT

The biggest challenge in implementing change is making it happen. Without the collaboration of people whose lives are going to be affected by the change, it is hardly possible. Ability to recognize what change means for people, and their reaction towards the proposed initiative, is crucial for leaders.  They must understand how to influence the attitude of their people, and how to build agreement and enthusiasm towards achieving the required improvements.

Management often takes it for granted that a good solution, especially one that has proven to be successful in other companies or other environments, will work.  However, even a very good solution is only a part of the success.  The other and very meaningful part is the ability to excite people to take the solution on board and put effort into making it happen.

In determining success or failure of any initiative, especially a major one, the key factors will often be the leaders’ ability to persuade and excite, to create trust and lead, often by personal example. This requires strength, passion and vision.  No less, it requires good communication skills, knowledge of concepts and techniques of motivation, and understanding patterns of thinking that are reflected in peoples’ responses and behavior.

The aim of this article is to look at the type of changes that TOC brings into organizations through the prism of understanding and interpreting peoples’ behavior.  The purpose is to build change-related messages so as to adjust them to the specific communication patterns of the people we need to win and involve in the change.

As the basis for communication patterns, this article uses the Language and Behaviour (LAB) Profile (1986) by Rodger Bailey[1], and practical recommendations of how to apply the LAB Profile for building a persuasive message as presented by Shelle Rose Charvet (1997)[2].  I learned the approach from Shelle Charvet in a series of training sessions in 1997-1998, and I have been using it since then. I find the techniques very helpful and enabling, easeing the process of communication through matching the language of responses to the communication patterns of counter partners.


Two types of change

This part of the article looks into the differences between the desired change and one imposed from the outside, as well as the differences between people’s attitudes and behaviour relative to the type of change they are facing.  What I am presenting is, to a great extent, a reflection of my personal experience and observations.  I have seen how people handle major change and themselves as the change is happening around them.

I come from a very small country of 1.4 million people that went through a drastic change from being a part of the former Soviet Union to eventually becoming a member of the European Union. (Just recently, it also moved monetarily over to Euro).  I believe I can understand what a major change means, and what it involves.

From the point of view of people’s attitudes and behaviour, we can distinguish between two types of change:

  • the change that people seek themselves, or “dream about”, or work towards getting, and
  • the change that is imposed from outside and people have to do something about it.

The key difference is in the perception and expectation of a person regarding the outcome that the change will bring for them personally – benefits or negative outcomes.

When we look at the first type – the change that people seek themselves, there are two main states in which people find themselves:

  1. I do not want any longer what I have now”, and
  2. I want THAT (something specific).”

When it is the “I do not want any longer” state, very often a person has no clear understanding of what it is that s/he wants.  Usually, it is just a realization of being dissatisfied with the current state of things, and a wish to change it.  However, the person does not know, or is indecisive of, what to change to. In other words, a person seeks change, but has no clear vision of the direction in which to go.  There is no clear and well-formed vision of the desired change’s outcome and no understanding of how to achieve it.

It seems easier for a person in the “I want THAT” state, as there is a vision or understanding of what it is a person wants.  There are people who intuitively know, or have been trained in how to determine, the desired outcome, to set the goals to achieve it, and have the mechanism to assess whether they are moving in the right direction.  If they are not, they know what corrective actions they should take.

However, we should not forget that the ‘THAT’ is only perception.  If the hopes are too high and the reality turns out to be different, it may result in disappointment, frustration and the bitterness of being disillusioned.

So, even handling the change that people want themselves is not that straightforward.

Dealing with the change that is imposed from outside is truly challenging

People are naturally cautious about the change that was not initiated or desired by them – about what it will bring.  They need time to think about it and decide whether they like it or not.  Often the immediate concern would be that the change planned by someone else will bring disturbance to the person’s everyday life – routine, work, daily activities – and will result in additional load.  As a rule this concern is justified because any change demands an effort.

With the imposed change, there are different change-related conditions:

a. A person has no influence over the decision to make the change, and no choice of not accepting it without physically moving themselves out of the changed environment.  However, this would often be impossible or too big a move to undertake only because they dislike the situation. In this case, people learn to behave in line with the change.

A simple example of that would be what I was observing at the beginning of year 2011 when my country was going over from the national currency to Euro.  Regardless of whether an individual was enthusiastic or unhappy about it, or how much effort had to be put into learning the new currency, understanding the new prices, etc, people had to accept the change and learn how to handle it in order to keep operating in the society.

b. People can ignore the change – both at the stage when the system is just considering the change, as well as after the decision about the change implementation is made.  When saying “people can ignore”, I mean that the system does not have the control mechanism to ensure the change implementation, or is not employing it.  If this is the case, the sequence of events and efforts that the system’s owners or managers pursue does not matter, (whether they first promote the change and then make the official decision about its implementation, or the other way around).  Any change requires an effort.  If people do not want it, and can refrain from making the effort that they see as imposed on them, then this is what is most likely going to happen.  What we often see then is a few enthusiasts personally excited about the change and pushing for it, and the majority who are trying to avoid the disturbance and extra effort that they associate with the imposed change.

If there is a lack of proper communication about the details of the change on the side of management, it strengthens in people the feeling of not being in control, and reinforces their concerns.  The change becomes even more unwelcome.

Management communication deficiency, however, is not caused by disregarding those who will implement the change and live it.  After all, managers bring change with the view of improving their systems. One way or another, the change will translate into benefits for those who operate in the system. At least, this is an expectation.

The reasons for difficulties with change communication are various. Often leaders want just a “big picture”, what they believe the organization will get as the result of change implementation.  If the solution is credible and proven, or if it fits their vision and belief in the potential of their system, they do not feel they need the persuasion of the details, the exact content of the change, and the HOW.  They may overlook the importance of these to people in the system.  Some leaders are by nature quick, proactive and entrepreneurial.  They see that as their strength and have the experience of getting things done through the approach of “Just do it, we will sort it out when we get there”.  Some do not feel there is a need to tell their people all the details, and certainly not the risks, to avoid creating a feeling of complexity and discouragement.

Many times they simply do not know how to communicate the planned change so as to get the support and enthusiasm of the troops.

Throughout this article I will be sharing with you what knowledge, concepts and techniques regarding communication and motivation I find to be useful in the process of change management.

Our actions and words are for a purpose 

I believe the cornerstone of successful communication is the ability to realize that whatever we do or say is for a purpose.  In other words, through communicating or acting we are trying to achieve something, whether we are conscious of it or not.

Quite often people confuse the purpose and the need.  Don’t we undertake an action with the purpose of satisfying a need?  It looks like a circle.  For communication, however, it is important to understand the difference.  The need is the cause. Actions/words are the effect.  We expect them to bring about the desired outcome which is a lot more concrete and tangible than the generic need it manifests.  Words and actions are nothing more than the means to get what we want.

Figure 1: The interrelation between the Need, the Action/Words and the Purpose

When actions/words are directed towards us, we want to understand what the person is trying to make us do? In other words, consciously or subconsciously, we are trying to understand the purpose of what was said or done to us.

Figure 2: Checking whether what was said or done to us is good for us

It is surprising how often people have no conscious understanding about the purpose of what they themselves have said or done.  Did it ever happen to you that you asked someone “Why did you do/say that?” and got a sincere response “I do not know”?

Related to that, there are some important questions to think about:

  • Do we always realize that, because we live in a society, whatever we say or do is actually directed to other people as a request/instruction for their action?
  • Do we always check that the other party will perceive our request/instruction as good and beneficial for them?
  • Do we ourselves check that our request/instruction will be good and beneficial for them?
  • Do we do our homework to help them see that it will be good and beneficial?

These questions are important because if people do not see our request/instruction as good and beneficial for them, we have a very little chance of getting what we want.

Communication and motivation

A generic and well accepted model of the motivation process looks like this:

Figure 3: The generic model of the motivation process

When we consider implementing a change – we want to understand all three elements of the process of motivation:

  • What are the needs that motivate people to take actions in different contexts? Especially, what are these needs in the context of the proposed change?
  • What is the resulting behaviour triggered by the need?
  • Achieving what goal/objective/purpose will satisfy their need?

Let’s return to the question that we asked earlier: Do we always realize that, because we live in a society, whatever we say is actually directed to other people as a request/instruction for their action?

In change implementation, when we communicate with the people who will become a part of the change and will contribute their efforts to making it happen, we want our words to be a motivator for their behaviour – to trigger their need for action to achieve the desired objective.

Figure 4: Our words as a motivator for other people’s behaviour

I would like to quote here J. O’Conner and J. Seymour:

‘Communication is a loop, what you do influences the other person, and what they do influences you; it cannot be otherwise. You can take responsibility for your part of the loop. You already influence others, the only choice is whether to be conscious or unconscious of the effects you create.’[3]

I find the statement about each person’s responsibility for their part of the communication loop very meaningful.  Responsibility requires a measured and thoughtful approach, understanding of consequences, accountability and integrity.  Whatever we do or say should be congruent with our values and should not be at the cost of other people. This fully corresponds to the third basic assumption of TOC that establishes Respect as a principle and the way of handling people, and states that there is no resistance to improvement.  If people do not embrace change, it means we have not brought them to see the win for themselves.

The outcome of the communication is the responsibility of the party sending the message.  To ensure that the message will go through in the best possible way, the sending party has to be aware of different thinking and behavioral patterns that people produce in the communication process.

With the purpose of better understanding thinking patterns that people demonstrate in the course of communication, this article will look at three of the six Motivation Traits of Bailey’s LAB Profile – Direction, Source, and Reason.  The whole LAB Profile concept is comprised of six Motivation Traits and eight Working Traits[4].

Toward versus Away from

The LAB Profile states that a person is triggered into action by an urge to gain a desirable outcome or to avoid an anticipated problem.  Based on that, it suggests two motivation directions: Toward and Away From.

From the point of view of the motivation process, it makes no difference whether the objective is perceived as gaining a desirable outcome or avoiding an anticipated problem.  It is the motivation of the behaviour that makes the difference: gaining versus avoiding.

Bailey suggests that people with different motivation directions will have different patterns of sentence structure and lexical means that they use in the context of discussing an outcome that they want, or are supposed, to achieve.  I believe most of us can substantiate from personal experience.

The table below shows how to recognize the motivation direction from what people say, as well as what language to use to meet the identified pattern.

The Toward/Away From approach is useful in understanding individuals’ Dilemma Clouds that present on one side, in D, a forced action, and on the other side, in D’, the preferred action.

Whenever we are faced with a forced action – if we consider taking it, it means that we are trying to avoid some unpleasant consequences resulting from not doing this action.  On the other side, our preferred action is desired because through it we are trying to gain something. Therefore, we can conclude that in a Dilemma Cloud the need in B reflects Away From motivation direction.  While the need in C, that causes us to want the action in D’, is Toward.

Knowing about the different direction of the needs B and C in the Dilemma Cloud may explain why the beginners often want to have a negative wording of the need in B (“Not …”).  They say that they feel that needs B and C are somehow conflicting.  It is not a conflict; rather it is just a different direction, Toward versus Away From.

Figure 5: Toward and Away From patterns as reflected in the Dilemma Cloud

Let’s look at a typical example of a Dilemma Cloud.

In one of the training sessions in TOC Management Tools, a Managing Director of a project company presented his problem.  The company undertook a project for a client. The Project Manager suggested an innovative way to run the project, and was supported by the MD who had been actively bringing new managerial approaches into the company.  In the course of the project one of the leading resources disagreed with the PM on some of the activities and wrote an email with her views, copying her Department Director.  The Department Director took the resource’s side.  The disagreement brought the project to a halt.  The MD needed to decide what to do. Below is his cloud.

Figure 6: An example of the Dilemma Cloud

We see that the forced action (D) is ‘Allow the Department Director to override the Project Manager’.  The need B that D is meant to satisfy is ‘Maintain the status-quo of the top management’.  The MD clarified that he felt he was forced to support the Department Manager who was older, had been working in the company longer than the MD, and had support of some of the top managers.  The MD said he could not afford rocking the boat.  The need B is clearly Away From.  At the same time the MD was putting in a lot of effort to bring improvements into the company.  Implementing changes was what he wanted to achieve. The need C is Toward.

What is the practical value of this understanding?  Most important, it gives us a deeper insight into what is embedded in the cloud, and what drives the actions.  This helps in surfacing assumptions, hence increasing the chance of finding the injection(s) that will break the cloud.

The Toward/Away From concept is also relevant for better understanding of a Negative Branch Reservation (NBR).  While our motivation to do an Injection can be either of the Toward position (to achieve something) or the Away From position (to avoid something), the NBR is clearly Away From.  We build the NBR to logically prove the likelihood of what we want to avoid, and look for the supporting Injection not to have the possible negative outcome.

Let’s move on to the next pair of patterns.

Internal versus External

Internal and External is another pair of LAB Profile patterns.  They constitute the Source category that distinguishes between the internal and external source of opinion, judgment, and decision making[5].

Internal people act as agents over their environments.  They rely on their internal knowledge, skills and actions to produce desired outcomes.  They make decisions based on internal evaluations.

External people require outside direction, other people’s opinions, and feedback from external sources.  They see themselves as objects, and their behaviour is essentially determined by outside factors.

To help recognize the pattern, the LAB Profile approach suggests asking a person ‘How do you know that you have done a good job at . . . [whatever is relevant for the conversation subject]?’

External people will refer to appraisal from their bosses or clients, or to the targets and measurements they met.

Internal people mostly refer to their own feelings: ‘I know’, ‘I was satisfied’, ‘it felt good’, ‘I liked it’.

It would be reasonable to suggest that in change implementation Internal people present more challenge for the leader.  However when, through their internal process of judgment and evaluation, Internals make the conclusion that the proposed change is good, they become its active and sincere supporters.  They feel that have true ownership of the new direction.

Six layers of TOC to describe resistance or disagreeing on the change[6] are relevant here.

Until we come to Layer 6, people are communicating to us through sharing their concerns, reservations and fears.  When we hear their reservations we can “pin” them to a specific layer, and we have TOC tools to deal with them. It is a generally accepted view that if we face Layer 6, when people stop communicating to us, we have missed something in the process of overcoming Layers 1-5.

I suggest looking at the process from the point of view of Internal/External.

I believe that the majority of voiced reservations come from the Internal people.  For Internals, what they hear is nothing more than information which they assess, and then draw their own opinion and conclusions.  If they disagree or have a reservation, it is natural for them to raise it since they have a tendency to look at themselves as agents influencing their own environment.  That’s why they talk to us and share their concerns – with the intention to sort them out. So, we have the “material” to work on.

External people, however, tend to rely on an external source and take the outside information as the instruction or order.  With that view, they are more likely not to see much sense in raising their objections, even if they disagree.  So, I believe that when we run into Layer 6, in many cases it is not because we have overlooked something in the previous layers.  It is that we simply did not have a chance to address these layers, as we may have never been given a signal from an External person that a disagreement existed.

This does not mean that saying ‘Yes’ (or saying nothing) and doing nothing is not experienced with Internal people.  When Internals realize that they are not listened to, or their reservations are overruled, they will just decide that they are not interested and withdraw.  It is also important to note that when management does not hear ‘No’, the assumption usually is that it means ‘Yes’.  Very often, this is not the case.  What we see is a person who did not disagree, but is doing nothing of what was expected.  Can we really call it Layer 6?

Options versus Procedures

The two patterns in this category, Options and Procedures, reveal the reasoning process model: looking for options or following established procedures.

The question ‘Why did you choose your . . . [job, project, company, etc., whatever is the subject of the conversation]?’ helps determine the pattern.

Options people hear the question WHY and list criteria of their choice or speak about opportunities and possibilities.

Procedures people delete the word WHY and substitute HOW for it, perceiving the question as ‘How did it happen?’ and answerng with a sequence of events.

Options people are good at identifying possibilities and creating opportunities. They are inventive and excited by options, and may become easily bored by the routine.  Procedures people like clear sequence and distinct guidelines.  It makes sense to have a combination of Options and Procedures people in a team that will be developing new procedures for the change implementation.  Options people will be instrumental in exploring various possibilities that the procedures should cover, i.e. specific cases, while Procedures people will look after the proper sequence of the procedural steps and detailed instructions.

Relevance for implementing the TOC change

Let’s see how the knowledge about language and behaviour patterns is relevant for implementing the TOC change.

When people evaluate the proposed change, they express their opinion about it, including their fears, reservations and suggestions.  The language that they use reveals their needs and their thinking patterns in the context of the change implementation.  If we know how to listen, we will be able to recognize these needs and respond to them, both through our actions and the tailored language of the message.

However, while communicating about the change, we often speak not to one single person but to a group of people.  We can expect that different people in the same group will have various patterns for information processing and decision making.

How can we make sure that everyone will hear the message, regardless of the difference in their patterns?

We should combine the words and phrases that will address most of the patterns.  With that, people will hear what suits them and filter out what does not.

However, before planning persuasive messages about change implementation, we should be clear on what it is that we need to communicate.

Planning the change

Preparing for the TOC implementation, we proceed from the understanding of the main elements that need to be considered for any system change:

  • the notions of the Target performance level and the Gap that prevent us from achieving this target level;
  • the three blocks of any system – the parts that should be stopped or replaced, the new parts that should be introduced, and the parts that should stay as they are.


Figure 7: The target level and the Gap

Figure 8: The three blocks of a system

When planning the change, clear communication is required with those involved regarding:

  1. The target performance we want to achieve, and the benefits everyone will receive as the result of the change;
  2. The Gap that exists between the current level of performance and the target level;
  3. Which parts of the system are responsible for the Gap, and thus are “erroneous” and need to be replaced;
  4. What are the new parts (the solution elements) that must be introduced to replace the erroneous parts to close the Gap, and to reach the target level of performance;
  5. What are the new procedures to introduce the solution and to ensure daily operation of the injections;
  6. Understanding that all the other parts of the system stay as they are as we look for the maximum effect with the minimum needed changes.

Guidelines for building persuasive messages

Let’s look at each one of the six messages that we need to communicate about the change from the point of view of the three pairs of communication patterns:

  • Motivation direction – Toward/Away From
  • Motivation source – Internal/External
  • Reasoning process – Options/Procedures

The suggested content and form of the message, even though addressing both patterns of every pair, does not seem repetitive.  It is because each time we will be looking at the same issue from two different perspectives.  In any case, every person reflects both sides of each pattern category, only to a different extent.

1. How to communicate about the target performance we want to achieve and the benefits everyone will receive as the result of the change:

2. How to communicate about the Gap that exists between the current level of performance and the target level:

3. How to communicate which parts of the system are responsible for the Gap, and thus are “erroneous” and need to be replaced:

4. How to communicate the new parts (the solution elements) that must be introduced in order to replace the erroneous parts, close the Gap, and reach the target level of performance:

5. How to communicate about the new procedures that will introduce the solution and ensure daily operation of the injections:

6. How to communicate that all the other parts of the system shall stay as they are as we look for the maximum effect with the minimum needed changes:

In the course of a TOC implementation, a TOC leader should also transfer the relevant knowledge about the TOC solution, terminology and tools to the team and resources.  There is a need to establish common concepts and common language and ensure that people understand what is meant by the major TOC terms.  It will be necessary that they accept and use this terminology on the everyday basis.


Part 2 of the article is presented in Chapter 4.

The continuation of the article looks into:

  •  Using the communication patterns discussed in Part 1 for communicating the major TOC logical tools: the U-Shape, the Cloud, the Negative Branch Reservation (NBR), the Injection;
  •  Major stages of the change implementation process
  •  How to persuade the relevant people to go for change

[1] Rodger Bailey’s LAB Profile examines the particular ways in which individuals act, think and speak and constitutes a classification of language and behaviour patterns grouped in 6 Motivation Traits and 8 Working Traits.

[2] Shelle Rose Charvet, Words That Change Minds, Iowa: Kendall/Hunt Publishing Company, 1997.

[3] Joseph O’Connor and John Seymour, Introducing Neuro-Linguistic Programming: The New Psychology of Personal Excellence, Aquarian Press, 1990

[4] Authors’ remark: The other three categories in Motivation Traits are: Level of activity; Criteria; and Decision factors. The full description of the categories is presented in Charvet’s book Words That Change Minds.

[5] Author’s remark: The meaning of The LAB Profile Internal/External patterns is quite close to that of the internal/external locus of control by Julian Rotter.

2. Together: TOC and Lean (Oded Cohen)

Oded Cohen

Oded Cohen is one of the most experienced and well known masters of TOC in the world. He has been developing and implementing TOC since 1978, over 30 years working directly with Dr. Goldratt.

Oded is a Co-Founder and Co-President of TOC Practitioners Alliance TOCPA,  International Director of TOC Strategic Solutions, and  a co-Founder of TOCICO and was TOCICO first President. Oded is an author of several fundamental books on TOC, as well as many articles and publications.


ABSTRACT

TOC has been around for over thirty years. Thousands of companies around the world have adopted it as their approach and system for managing production and operations. The application of TOC solution for production and operation has been proven to improve their performance to outstanding levels and to provide a solid base from which to support future growth in sales. Due to inadequate access to TOC material in some areas, managers who are relatively new to TOC may find themselves in a debate – shall they go TOC or shall they implement Lean?

In this article, I would like to replace the question of which one is better with two other questions:

1. How do TOC and Lean work together?

2. Which one should managers use first as a platform for converting their production, or operations for service companies, in order to provide outstanding service to their clients?

The objectives of TOC and Lean are identical: to provide a systematic way of managing the flow and continuously improving it. This is based on the confidence that providing the market with a high level of service is a key element in creating a competitive edge for securing the growth of the company.

This article covers the ways TOC and Lean interrelate and, some ideas of how to incorporate TOC in your plants, if Lean is already incorporated into the way you run the production area. If you haven’t decided yet which way to go, I hope my views will help you to make an informed choice.

Introduction

For at least 200 years the world of management and, especially, the management of production and operations has seen many approaches and philosophies. There is an ongoing debate on the subject of TOC versus other management approaches. The perceived merit of making such a comparison is to find which one is better and discover the magic winner that has all the answers to all managerial questions, and will secure everlasting prosperity and success to the companies that employ this winning approach.

The reality is less glamorous. Many of the companies that won awards and recognitions in the early 1980’s for implementing managerial approaches did not show growth in their bottom line and some even went out of business within 10 years of winning the awards. In the late 1980’s, many studies were conducted to distinguish TOC from TQM –Total Quality Management. Dr. Eli Goldratt then wrote an essay[1], challenging the concept of the “or” and suggesting the direction of the “and”. When the different managerial approaches have the same goal, why not adopt the mindset of amalgamation. Create a united approach that complements each other, while taking the strong points from every approach and covering the weak points. Many organizations adopted this attitude and incorporated TOC into their TQM approaches.

In the spirit of the “together” I was involved in writing “Deming & Goldratt”[2]  with Dr. Domenico Lepore. Together, we built a ten step approach we called the Decalogue that combined concepts and practicalities from Deming’s TPK, the Theory of profound knowledge, and Goldratt’s TOC. This book has provided a bridge for the Deming community and the TOC community to know about each other, and to enhance their own approaches by introducing ideas, concepts, methodologies and procedures from the other approach.

In a similar way, I would like to offer my support and views to bridge between the Lean community and TOC by using my deep understanding and knowledge of TOC concepts and of the TOC solutions.

For over ten years, we have been witnessing the continuous debate of TOC versus Six Sigma and/or TOC versus Lean manufacturing. Many companies, with the help of practitioners from both “camps” have succeeded in creating an amalgamated approach that has successfully worked for them. If you want to substantiate the above statement, you need only to search the web for TOC and Lean. In a recent search with Google, I found over 300,000 references. Many of them even use the name of the combined approach, TLS; TOC-Lean-Six sigma. These references describe not only how to combine these approaches but also, and most importantly, the value and the benefits of the combination.

One early example of TOC and Lean, released to the public domain, is the US Marine Corps maintenance depot[3] that can be found on TOC.tv. They presented outstanding improvements in reliability, level of output, reduction in lead times, and cost. In their case, TOC was the lead approach.

In this article, I am using my own experience in working together with the Lean team in a British company, two years after they successfully implemented Lean in their company. Like the Marine Corps, this company refurbished armed vehicles. The improvements in the first two years were remarkable, yet they felt they were stagnating and could not squeeze out more improvements. The plant manager read The Goal and asked us to visit them. Immediately thereafter, we started working together to incorporate TOC into their environment.

Both TOC and Lean promote continuous improvement.

TOC clearly states that the role of management is to ever improve the performance of the area under their responsibility. The performance of the production area is determined by the flow. Hence, the most important role of production management is to maintain the flow and to continuously improve it.

In his article “Standing on the shoulders of giants”[4] Dr. Eli Goldratt outlines four major concepts for managing flow:

  1. Improving flow (or equivalently lead time) is a primary objective of operations.
  2. This primary objective should be translated into a practical mechanism that guides the operation when not to produce (prevents overproduction).
  3. Local efficiencies must be abolished.
  4. A focusing process to balance flow must be in place.

We shall use these concepts for examining TOC and Lean and getting the most of both. For that we need to cover three areas:

  • The alignment between both approaches
  • The areas where TOC agrees with Lean
  • The areas where TOC ideas differ from Lean

Thereafter, we can discuss the practical ways of how to work TOC & Lean or Lean & TOC. Please note that I am referring in this article to production management. Yet, everything that I say here is relevant for managing any flow environment. The more general term for managing any flow is Operations management.

Concept no. 1 – Improving flow (or equivalently lead time) is a primary objective of operations

The alignment between TOC and Lean

There is a full alignment between the TOC and Lean on the first concept – improving the flow is the primary objective of production management. Production is the function that is responsible to convert, through flow, raw material and components into a sellable product. To ensure the contribution to the overall performance of the company, production has to complete every work order on time, according to the specifications (quality), and within the agreed cost.

The production lead time is a critical factor in generating value, as money is generated for the company only when its product has been delivered and the customer pays for it.

Production flow is comprised of several dependent activities.  Lean suggests mapping the key elements of the lead time though the recording of the Value Stream (VS). The value stream determines the overall lead time of production. By mapping the value stream, management signals that the flow is of utmost importance. The VS diagram is posted in key areas in the shop floor, and everybody is aware of the flow and their own role in the value stream. The VS is in line with step 2 of the Decalogue; seeing the system. To improve a system, we must know the system and see it as such; where it starts and how the major components are connected.

Value Stream is a solution promoted by Lean.  It is a powerful solution. So, what is the problem with it?

The problem is the disconnection between planning, execution and improvement. For production planning and control, a fixed, predetermined time is used. Usually it is called production lead time (PLT). Production starts at a given time and is expected to be completed within the agreed time. However, due to disturbances, disruptions, and statistical fluctuations of the processes, many times the order is not completed and shipped on time.  Traditionally, the solution for this problem was to increase the production lead time and start the flow even earlier. This solution only made the situation worse. The earlier that work orders are released to the shop floor, the more orders we have there.  This creates even more traffic congestions as the load on capacity constraint machines grows and the queue gets longer and longer. Increasing the production lead time may be a short term recovery action, but it cannot be a regular solution as it conflicts with the first concept of the flow that seeks to improve the lead time.

The VS was introduced to facilitate systematic improvement.  It helps to focus management and people on the flow by providing a flow map of the products throughout the shop floor.  It provides the platform for continuous improvement where other Lean tools and techniques may be employed. The activities of the VS are grouped to be performed in work centers. The Grouping is done in such a way that the timings to perform the grouped activities are of a similar length. Usually, the grouped activities are performed in one work station. The time to perform grouped activities is called Takt time. The overall expected production lead time is calculated by multiplying the Takt time by the number of grouped activities. The calculated production lead time is used for planning purposes, and for promising delivery times to the clients.

Likewise, TOC acknowledges the critical role of production lead time for flow management: planning, controlling the execution, and for continuous improvement.  However, TOC suggests a shortcut to get the system going and achieve immediate improvements in performance. This is done through the establishment of the Production Buffer (PB). PB is the total elapse time that is allocated for the production to complete the order. The term “buffer” is used by TOC to denote time including more than the average processing time on the machines (touch time). It also includes allowance for setting-up the machines for specific parts or products, queue time in front of occupied machines, wait time for missing parts in assembly, as well as unexpected problems known as “Murphy”. In most production environments, the touch time is a small fraction of the production lead time (1% or less).[5]

The SDBR (Simplified Drum-Buffer-Rope) is the TOC solution for MTO – Make to Order. MTO is a production environment that produces to customers’ orders. SDBR uses the production buffer (PB) for flow management. When the actual touch time is so small compared to the elapse time, there is no need for a detailed mapping of the value stream. Actually, for SDBR, we propose choosing an ambitious size for the PB which is challenging but achievable; shorter than the production lead time that was used by production at the outset of the TOC implementation.

Managing through the TOC production buffer provides the same managerial focus as the value stream. The advantage in using TOC is the ease and speed of implementing the solution, as well as integrating it in to the computerized systems. Sometimes management can use simple excel files for the purpose of flow management.

Another difference with TOC is the upfront and open commitment to the first concept – improving the flow. For the successful implementation of the TOC solution, management has to commit to adopting the mindset that flow is number one priority.  This is reflected though making on-time delivery of customer orders the prime measurement for production performance.  Thereafter, in a systematic way, the production buffers are adjusted to improve the lead time, and for the company to gain competitiveness in the market place.  The concept of production buffer is captured also in the name of the TOC solution SDBR. The B stands for Buffer.

The major difference between TOC and Lean in maintaining and controlling the flow is with the mechanics that are used.  Lean uses the value stream. Given that there is no economical justification for building dedicated production lines which are effective but relevant only for very high volume repetitive products (such as cars, electronic equipment etc.)  Lean tries to emulate lines through the concept of Takt. Takt is the mechanism that provides the rhythm to the value stream. Stations are organized in such a way that they have roughly the same process time. Thereafter, every Takt time, the Work Order (WO) moves from one station to the next one. As such, the flow is established and work stations have to keep up with the pace.

For example – the MRO company that I mentioned above had 10 work stations covering the entire value stream, with a Takt time of 2.5 days (two moves per week). That determined the total lead time of 50 days. This was a significant reduction from the 70 days that they started with. Stability had been improved and more vehicles were shipped on time.

However, there are several disadvantages to the Takt approach:

  1. It is not always easy to group the activities in one work station that will fit the Takt time.
  2. To compensate for fluctuations in performance, some slack time is built into the Takt time. Potential gains due to positive variation when a station completes its activities earlier than predicted are not past to the flow and are wasted in waiting.
  3. The Takt time should be equal for all products that are produced in the “line”. This reduces the flexibility and ability to run different products and product families using the same resources.

The TOC solution covers for these disadvantages. Once the WO is released for production it can move freely between the different work stations. Once work on the WO is finished on this station, the WO moves to the next station. The loading to the machines is done according to the priority determined by buffer management ensuring that higher priority is given to WOs that are close to their delivery dates. The TOC solution accommodates products and product families with different Production Lead times. Also, it can accommodate orders with short response time (for premium prices).

Concept no. 2 – Prevent overproduction

This primary objective should be translated into a practical mechanism that guides the operation when not to produce, thus preventing overproduction.

In the second concept there is also a full alignment between TOC and Lean while the mechanics differ.

Lean prevents overproduction by using two major methods:

  1. Controlling WIP and the start of new production WO, by the number of empty slots available. The number of holding positions, when a WO is parked and not worked on, is limited. Ideally, work on a new WO should start on the first station only after a WO has been completed and has departed from the last work station of the VS. It is the concept of one-out one-in. The number of WOs in the VS is fixed. After one WO departs from the VS, a new one enters.
  2. In points of assembly – using the 2 bin approach for the parts and components that are supplied from a feeder. The parts are stored in 2 bins available for assembly to use. Once one bin gets empty, a signal is given to the feeder to produce and deliver a replacement bin.

Both mechanisms prevent overproduction. They present the concept of fixed WIP. The first one fixes the number of WOs in WIP to be the number of work stations in the VS. The 2 bin mechanism limits the WIP to 2 bins only. As long as people adhere to the instructions, it is impossible to release more materials to the shop floor.

The mechanism of one-out one-in for the VS was significant in the MRO environment. Before the Lean implementation, the tendency was to disassemble the vehicles as soon as they appeared at the depot. This elongated the time that the vehicles spent in the depot while the army units were missing them. They wanted the decommission time to be as small as possible.

The VS prevents overproduction and provides stability. Thereby, it helps to improve the overall performance of the production area.

At the same time it is important to know its shortfalls:

  1. VS is applicable in a highly repetitive environment that has stability in demand for long periods (years).
  2. VS is applicable for products and product families that have the same structure and about the same production times.
  3. It is not planned to provide “fast track” service to some of the orders. All the WOs have to follow the same flow in the sequence they have entered into the VS.
  4. The VS does not address the issue of the feeders that are supposed to provide parts and subassemblies to the work stations of the VS.

The availability of parts and components for assembly in the MRO company that was mentioned above was the major reason that TOC was called in. It was impossible and impractical to create a value stream for all of the feeders. The VS suffered also from shortage of non-standard parts. In such cases, some of the vehicles finished their VS journey incomplete and were put in holding positions until the missing parts arrived. In some cases, vehicles were removed from the VS in order not to block the other vehicles that could move.

In summary, shortages of parts for the VS caused disruption to the flow and hurt on-time delivery to the customers.

SDBR has a simple mechanism to prevent over-production without having the shortfalls of the VS. It is called the “Rope”, meaning choking the release. WOs are not released to production before their calculated release date. This date is calculated as the promised shipping date minus the production buffer time. The rope reduces the amount of open orders. This reduces the overall load on the machines and resources. The open orders get the right priority and, due to better availability of machines, are completed on time. That is the reason why correct SDBR implementations bring significant improvement to production through increased Due Date Performance (DDP) and reduced WIP within a short time.

The Rope mechanism is used not only for the main stream but also is extended to the feeders. Once the delivery date is committed to the customer, the same production buffer is used to signal the feeders to start their activities to ensure that the parts will be available for assembly.

The above two mechanisms of the SDBR, buffer and the rope, provide a simple and practical solution to prevent overproduction without risking the delivery dates. The simplicity of the system is denoted also by the name SDBR – the “S” stands for Simplified Drum-Buffer-Rope.

Concept no. 3 – Local efficiencies must be abolished

This is an interesting point.

Conceptually, TOC and Lean should be completely aligned.

Efficiencies as performance measurements and, the use of cost based management accounting for decision making, should be stopped. The major problem with this type of decision making is that it contains a real risk that local decisions will be made that will have negative impact of the flow. The late Dr. Ohno of Toyota admitted that he was forced to fight cost accountants, and to chase them out of the factories in order to allow his system to work. By the way, the TPS, Toyota production system, is not pure Lean.  In fact, the Toyota people in Japan do not agree with the term Lean to describe their system.

In reality, the descriptions of Lean cover a lot of techniques and methodologies. They do not contain any message regarding local efficiencies. This presents a risk to the Lean implementation. Local management may understand that to allow Lean to work they should stop local efficiencies. That can bring them into a clash with their corporate headquarters, if they are a part of a larger group. On the other hand if the local management decides to abolish local efficiencies, and does not know with what to replace them, they may lose control as the managers reporting to them will not know how to make the right decisions.

Abolishing local efficiencies was high on the TOC agenda from as early as 1980’s. Besides the demand to stop using local efficiencies for measuring performance of departments, machines or manpower (“what to change?”), TOC has also provided clear, practical concepts and methods to replace them (“what to change to?”). Such as:

1. Making on-time delivery the prime measurement for production performance:

  • DDP – Due Date Performance – to denote the level of reliability of the shipping according to the promises to the customers. This is presented through the percentage of orders that are shipped on time (on the actual date that it was promised or before, but no later than the promised date).
  • TDD (Throughput Dollar Days) or TVD (Throughput Value Days in local currency) to denote the financial impact of the customers’ orders that are late, and the amount of days that they are late. This has a financial impact on the company as it hurts cash flow. This is the amount of money that could have been already in the company’s bank account multiplied by the number of days (that the money could have generated value for the company).

2. TOC (Throughput) Accounting – providing management with a set of operational measurements to bridge between the local decisions and actions to the global performance. The three operational measurements are:

  • Throughput (T) – the money generated by the system.
  • Investment (I) – the money invested in the system, including facilities, machinery and materials, and
  • Operating Expenses (OE) – all the money that is regularly spent on running the company and generating Throughput.

TOC emphasizes that production management should focus on flow.  If flow is number one, then all the rest, quality and cost, will fall into place and will be in control. In the SDBR Solution, “D” stands for Drum. This is the concept that customers’ orders drive the production system. The company’s commitment is the driver for the production system. The shipping plan (schedule) is the way the company builds market awareness and its acceptance as a reliable supplier.

There is no conflict between TOC and Lean on the third concept. It is just that it is not a part of Lean. We believe it is absolutely necessary for a company to establish its position in the market place. TOC can cover for this void.

Concept no. 4 – A focusing process to balance flow must be in place

This is the area where TOC and Lean are not only aligned but also can work together in full synchronization.

To balance the flow, there is a need to address and remove any obstacle and obstruction to the flow.  Once we do so, we allow production to flow better, and faster.  This is where all the tools and techniques of Lean can be utilized.  Disruption to the flow can happen due to lost capacity from machine breakdowns, quality problems, process instability, long set-ups, etc.  There are very powerful tools and ways in Lean to address such issues.

TOC is a managerial approach. It deals with managing the flow. TOC can help in highlighting the problematic areas in the flow that must be improved. But, TOC does not have any technical improvement techniques. TOC completely relies on Lean to provide improvements in the places where these improvements will contribute the most to the objective of improving the flow.

Whereas the TOC implementations incorporate Lean in the POOGI – process of on-going improvement, we have concerns about applying the Lean improvement in isolation from the global view of the flow.  The fact that Lean does not call to abolish local efficiencies, gives rise to the TOC concern. If local efficiencies are not abolished, then the prevailing decisions made by management are cost-based. That can lead to waste of the efforts that are put on improvements. For example: Setup reduction is a very powerful technique. It can help dramatically to improve the flow. If we have a machine that is lacking capacity, setup reduction will create additional capacity that can improve the flow. However, if a non-constraint machine, a machine from which the load demanded is less than 70% has a high setup time, a reduction in the setup time will not necessarily translate into a better flow or more throughputs. As the operator of the machine is on salary, the company is not going to realize any major benefit from the effort to reduce the setup.

TOC provides direction for management focus, as they know which resources are constraints and which are not. As the improvements are focused on improving the flow, the first priority should be assigned to deal with the CCRs, the resources that do not have the capacity to maintain the flow. The second priority should be assigned to the non-constraint resources that disrupt the constraints or cause major delays to the flow.

TOC has a strong focusing mechanism for POOGI. It is called Buffer Management. It is a part of the SDBR solution. While a work order is in progress its status is constantly monitored based on the consumption of time by this WO from its production buffer. At certain points in time (determined by the on-going managerial procedures of running under the SDBR solution), the system prompts sampling of the flow. While sampling, the system checks for the reasons for the delay. What is the WO waiting for? It may be waiting for a resource that is busy, for materials that were late to arrive, for documentation or drawings from engineering etc. The date is recorded and analyzed. Periodic meetings, ideally weekly, review the findings and decide on improvement initiatives to address the reasons for frequent and repeated disruptions to the flow.

The improvement initiatives employ Lean techniques, but not only Lean.  Some of the causes for disruptions to the flow may be connected to the human factor such as: lack of skills, knowledge, awareness, attitudes, authority etc. The analysis of the causes can be done by using TOC tools and Thinking Processes to deal with such problems. From time to time, a deeper analysis may demand the development of a more strategic solution using the TOC methodology for developing a solution.

We believe that TOC buffer management is a good focusing mechanism for all the improvement initiatives of the production area. Every problem solved and every disruption removed improves the flow, makes the production area more reliable, and provides a potential competitive edge for the company.

Conclusion

TOC and Lean work together!

The TOC community works together with Lean leaders and practitioners within companies that are using Lean. Such collaboration is a win for everybody.

If you haven’t implemented Lean yet, then my recommendation is for you to list your expectation from taking the initiative, TOC or Lean. Determine the criteria and check the suggested alternatives against these criteria. And then, make the decision according to what is more beneficial and preferable for your company.


[1] E M Goldratt – TOC Journals Volume 1 no 6

[2]  Deming and Goldratt, Domenico Lepore and Oded Cohen, North River Press, 1999

[3]  U.S. Marine Corp – Logistics Base – presentation – TOC.tv

[4]  E M Goldratt, “Standing on the shoulders of giants” – published also in this volume

[5]  Please note that environments with high touch time of over 10% of the current lead time need a special application of the TOC solution for production.

This article was first published in the Goldratt Schools book TOC for Production Management, 2010, published by TOC Strategic Solutions


All materials available on the TOCPA site are the intellectual property of their authors and cannot be reproduced in any other media and used for any purposes without the prior permission in writing of the authors.

1. Failures in the High Street (Martin Powell)

Martin Powell

Martin Powell is Director of Goldratt Solutions Ltd. and The Goldratt Centre Ltd.

He is the Founding member of TOCPA.

Martin Powell has been implementing TOC, training clients and other consultants in all aspects of TOC for over 20 years. His implementations and assignments have covered Operations, Supply Chain, Distribution, Project Management, Sales and Marketing, TOC Accounting and Measures and have been spread over more than 20 countries.

m.powell@goldratt.co.uk

http://goldratt.co.uk/


This chapter was written in 2011.

In the middle of 2011 some major UK High Street brand names were brought to their knees, with the devastating effect of more losses of UK jobs. Remember how, in the 1990’s all those manufacturing jobs went because UK manufacturing was not competitive enough! Is the same happening in Retail?

These failures in Retail are usually caused by the businesses just running out of cash – in other words they have borrowed too much, their inventories are too high and when sales drop so does the cash flow. The banks lose confidence and pull the plug.

Let us explore where the real problem lies for retail.

In order to be an ever flourishing (as Dr Goldratt termed it) retail business, the management has to do a balancing act – both stability and growth are important. This means building their own competitive advantage without taking too many risks.

Traditionally, the approach is to try to gain an advantage from lower prices and physical presence. The price advantage they strive for comes from buying more and more from the far east and emerging countries where the wages and cost of production are lower. However, this approach has disadvantages mainly in the form of much longer lead times to get supplies to the UK, quality issues and very large minimum order quantities.

The physical presence advantage that they strive to get is by opening more and more stores in an already saturated market. This pushes up their operating costs, such that when a downturn happens they have to close many stores in order to survive.

The real way to gain the advantage without taking too many of the risks mentioned above is to satisfy significant consumer needs better than any significant competitor can. So the question we should then ask is – what is the consumer’s significant need? We can say price; we can say quality – however, if the products are not AVAILABLE then price and quality are secondary. The most important need for even standing a chance of making a sale is availability.

Expecting to find an SKU and being disappointed severely erodes the consumer’s impression of good availability. Shelf space is usually the shop’s constraint for better availability.  A significant amount of the constraint is captured by merchandise that was ordered according to an overly optimistic forecast. Offering many products that the market doesn’t want is not contributing to the impression of availability.  When the product’s market-life is not long, the slow reaction time of the supply chain causes the offering to be based more on educated guesses, rather than on actual market preferences.

Shortages are the main reason for a consumer’s disappointment.

The current mode of operation of most supply chains, a mode of operation that is based on forecast, causes the supply chain to have a long replenishment lead time.  A long replenishment time causes shortages and high inventories that block the shelf space and impair the ability to adjust the offering to the actual market preferences.

Shortages and high inventories do not only erode availability, but also (dramatically) reduce sales and increase investments.

So the pivotal change, the “What to change?”, is to stop operating according to forecast.

The direction for the solution, the “what to change to?”, is to start using TOC Pull-distribution – switching to a mode of operation which is based on actual consumption. Under this counter-intuitive approach, whatever is sold to the consumer is replenished to the stores from warehouses – let’s say Regional Distribution Centres – on a very frequent basis (e.g. daily). The shorter the frequency, the less quantity that the store needs to hold as inventory and hence with the same space, the greater the range of products is can hold and display. The RDCs are replenished – what was shipped to the stores – frequently (e.g. weekly) from a Central Distribution Centre. At both the RCD and the CDC we gain the advantage of aggregation – which means that the variability in demand is much narrower than at the store level.

For Retail this switch to frequent replenishment of actual demand, together with a proper incentives scheme to the suppliers (or better, to have suppliers which use the same consumption-based mode of operation), ensures very high availability coupled with surprisingly high inventory turns.

Of course there are many “yes I see the benefits of the direction but ……” reservations. What about new products? What about running full trucks? What about seasonal products? What about …..?”

All of these reservations can and have been dealt by companies that have implemented it, although the exact way each is handled depends very much on the specific case and the decisions of management. These reservations are dealt with under the heading of “how to cause the change?”.

First we have to ask ourselves –is pursuing this direction worth it. To answer this let us review briefly four recent public presentations of results (we do not have permission to disclose company names in this article). If you are the sort of person who looks at what others have done and usually says “yes I can accept that they got results but we are different……” then stop reading this article now. If you are more open to see the commonality then read on.

Case 1 – Liberty Shoes

This organisation, based in India, is in the top 5 footwear companies in the world with over $100m sales and producing 50,000 shoes per day. The company produces varieties of ranges covering virtually every age group and income category. The products are marketed across the globe through 150 distributors, 350 exclusive showrooms and over 6000 multi-brand outlets, and sold in thousands every day in more than 25 countries including France, Italy, and Germany. The outwards supply chain includes 120 Distributors / Wholesalers (who sell through 10,000 multi-brand stores) and their own retail chain of 30 stores and 400 franchise stores.

Prior to the TOC implementation the five production plants were supplied with components, raw materials and some finished product by the vendors. The plants then sent the products direct to the Distributors and their own and franchise stores. The plants were competing with each other to sell product and generally they operated on a “push” basis. The results of the way they were managing, for the company, were:

  • 130 days of stock
  • 70% availability
  • Flat sales for 3 years
  • Not making profits
  • More than 400,000 pairs of shoes as non-saleable stock

For its customers, Distributors and franchisees the results were:

  • 1.0 to 1.4 inventory turns
  • Barely making profits
  • Being supported by the company with huge discounts
  • Surplus stock older than 1.5 years

For their own retail stores the results were:

  • 1.5 inventory turns (8 months cover)
  • Huge stock outs and surpluses
  • Sales stagnant
  • 4 years of losses
  • Inventory investment was blocking expansion

Before the implementation started the whole of the company’s management were conducted through a consensus process covering “What to change – What to Change to – and How to Cause the Change” by the chosen TOC Consultants. This concluded with a full implementation roadmap which included the following main steps, which were implemented:

  • Central planning for all 5 plants
  • Central sales for all 5 plants
  • Established a Central Warehouse (aggregation point), to which all the plants supply. They do not supply to customers directly now.
  • Plants transformed from “Making to Stock” into “Making to Availability” (stock buffers) and Buffer management
  •  All Raw Materials and components on “Purchase to Availability”  and Buffer management
  • Implemented dynamic replenishment with suppliers
  • The shops send weekly orders to the Central Warehouse
  • Replenishment weekly
  • Order generation and dispatch of individual SKUs rather than All Size Packs
  • New introductions of smaller range, 8 times a year

The results after one year of implementation in the retail chain were:

  • Inventory – down from 8 months cover to 4 months (like for like stores)
  •  Availability up from 70% to 95%
  • Sales increased by 64%
  • New range introductions up from 2 per year to 8 per year
  • Inventory turns of distributors and franchise stores tripled

The biggest gain is risk free expansion. The stores were operating profitably on 5 inventory turns. This means that huge amounts of capital had been released for investment in new stores, which require less than half the starting inventory compared to before the implementation.

In summary the closer alignment of supply with actual demand has increased sales at the same time as reducing inventory. This enabled the released cash to be re-invested in store expansion driving up sales even further. Gaining more franchisees is now easier with a lower inventory investment needed for the same level of business.

Case 2 – Titan Jewellery

This organisation, based in India, has over $1bn of sales through 150 stores. This industry typically has very low inventory turns with severe peaks of demands leading up to “special days” – such as one would expect for Valentine’s Day.

The pre-implementation scenario was that the stores were collectively holding, on average, about $3.5 million of inventory. Each store held approximately 5000 SKUs with one piece of each.  The average daily sales for a store were 50 SKUs per store and inventory turns of 3.

Before the implementation started the whole of the company’s management were conducted through a consensus process covering “What to change – What to Change to – and How to Cause the Change” by the chosen TOC Consultants. This concluded with a full implementation roadmap which included the following main steps, which were implemented:

  • Improving the availability of “best sellers” – fast movers
    • Create a central buffer to support fast movers (about 3% of SKUs)
    • Auto replenishment of sales by the stores within 3 days
    • Dynamic Buffer Management
    • Regular review of “best sellers” by store and those not selling are returned to central buffer
    • Stores able to choose products they want to trial
  • Improving the supply and variety to the stores
    • Implement Pull Distribution and Buffer management – from stores through to central warehouse – through to Production and Vendors
    • Daily systematic process at stores, based on what is selling, to request product or closest variant from centre
    • Support seasonal peaks with central inventory with fast supply, rather than individual store forecasts
  • Refreshing slow movers
    • Match the slow movers in one store with a store where the SKUs are selling – recall the SKUs back to centre and redistribute
    • Replace recalled SKUs with others chosen by the store
  • More effective new product introduction
    • Stop the major bi-annual introduction of 10,000 new items
    • Introduce refreshers only in categories and price bands that need them
    • Proper testing in restricted store before becoming widely available
    • Use a rotation approach around the stores so that they are always having something new – meaning that particular store has not had it before

The results after 1.5 years of implementation in retail are:

  • Stock turns increased by 22%
  • Sales increased overall by 12%
  • For the main “special day” time period;
    • 58% increase in sales
    • 19% reduction in inventory

In summary the closer alignment of supply with actual demand has again increased sales at the same time as reducing inventory. In this sector the margins on gold are significant, so the sales increase with little increase in operating costs has a very significant impact on the profitability.

Case 3 – Big Frango – Chicken Products (Fresh/Frozen)

This organisation, based in Brazil, has over $350m of sales operating from 3 plants and through 6 distribution centres. Their sales are segmented 50% Retail, Wholesalers 20% and Export 30%.

This case started with the usual Data Collection by the chosen TOC Consultants. An Executive Worksop followed with the senior management of the company. The core conflict identified was:

A: The common objective was to increase return on investment

The two necessary conditions were:

B. Increase sales

C. Reduce inventory

The conflicting actions were:

D. In order to increase sales we must push inventory along the outwards supply chain

D’ In order to reduce inventory we must let inventory be pulled along the outwards supply chain

The paradigms in the supply chain that needed to be changed were identified as:

  • Local optimum – For one to win the other one link in the chain needs to lose
  • Economic Order Quantity “saves” costs
  • Suppliers are not reliable
  • Inventory must be closer to the consumption point
  • Better Truck utilization is highly important
  • Retail gets better prices for buying high quantities

It was agreed to conduct a pilot implementation in part of the supply chain, in order to determine not only the magnitude of results but also the challenges of a full implementation.

The approach had to create a new relationship based on “I want to make money with you, not from you ….!”

The constraint of supply was identified as the production capacity. The exploitation was therefore to focus on the most profitable products (Throughput Per Shelf) and move sales from Wholesalers to Retail. A major challenge was considered to be getting the retailers to provide their daily sales at an SKU level; however, this was part of the selling of the “inventory turns” offer to customers. So the obstacle was overcome with a value based selling process and education of the sales team.

Nine key strategies were implemented:

  1. Daily retail inventory and sales information (SKU level)
  2. Increase SKU replenishment frequency
  3. Sixty days prices agreements
  4. Inventory levels redefinition for each warehouse and store
  5. Inventory Aggregation
  6. Dynamic buffer management implementation (Big Frango and Retailers)
  7. TVD and IVD Implementation – Throughput-Value-Days to measure lost sales and Inventory-Value-Days to measure inventory
  8. Shelf space negotiation
  9. Sales team measured by actually satisfied sales and product mix rather than volume

During the 3 months pilot implementation (not all plants and distribution centres):

  • Sales growth was 82%
  • Out of stock risk was reduced by 65% – measure by TVD
  • Reduction in inventory was 57% – measured by IVD
  • Market drop in price 6% – their prices increased by 5%

Additional benefits were more fresh products on the shelf; higher customer loyalty; and less stress between parties.

In summary the closer alignment of supply with actual demand has produced significant impact through to the bottom line. The additional main feature of this case is the change in the relationships in the supply chain from “confrontational” to “collaborative” because everyone wins from the solution.

Case 4 – Cosmetics

This organisation has over $2.5bn of sales through 2,000 points of sale in Brazil and over 1,000 points of sale in 9 other countries. This industry is typified by severe peaks of demands, especially driven by promotions and around “special day” campaigns.

The company has one plant with one Distribution Centre (located 135 miles away from the plant). The DC sends products weekly to all 300+ stores as there are no Regional DCs. The environment is subject to high demand variability. There are about 600 active products with 200 launches of new products per year but the increase in demand can be as much as 1000% in one month for some SKUs. The organisation was also suffering from limited supply chain visibility – making decision making more difficult.

Their undesirable effects were – too many out of stock situation at the franchisees; inventory coverage was too high; difficulty planning around the large number of promotional campaigns.

The basic solution was to move to Replenishment and Make to Availability with Buffer Management. However, there was concern that the regular solution and algorithms would not react fast enough to the sudden rises in demand. There was also concern that the MTA Buffer method relies on historic data about consumption and that for the many new products, no such data was available. The designed solution was to have a hybrid system, where regular demand drives MTA (pull) and Special Events or Promotions were driven by Forecast (push).

The pilot implementation covered 2 large franchisees with collectively 150 points of sale. There was significant preparation work needed to build collaboration with the franchisees before launch. This took 3 months. The targets set for the following 3 months of the pilot implementation were:

  • Inventory turns to be increased by at least 20%
  • Stock-outs to be reduced by 30%

In order to make this two system approach (pull and push) effective it was needed to introduce a “Collaborative Demand Planning for Events” process and a weekly “Collaborative Replenishment” process.

Under the Events process, the company, particularly manufacturing (so they can support the plan), prepares a statistical forecast based on past data and events. This is sent to the franchisees for feedback and adjustment. Once agreed this forms the basis of a push of product from the centre to support the event.

Under the Replenishment process, weekly each store inventory is adjusted for consumption and as needed the buffers changed. The planned replenishment according to the buffers is sent to the franchisees for approval. This helps with the buy-in of the store managers to the new system such that by the end of the pilot several of the stores were running on automatic replenishment.

In summary, the pilot was extremely successful.

  • Sales increased by 60% with a reduction of inventory
  • Stock-outs were reduced by 38%

Conclusion

So these cases, which are just a sample, indicate that the TOC Pull Distribution solution brings huge benefits, in inventory reduction; sales increases; less stock outs; investment expansion; more collaboration and less stress. The cases show some of the variations needed to the standard solution.

If you would like to read more about how to approach retail, then we recommend the book (novel) “Isn’t It Obvious” By Dr Goldratt. The assumptions, challenges and actions needed are woven throughout this book but answers are not handed to you. As you read, along with the characters in the book, you work through the process together to discover and understand the solutions and how they are implemented.


All materials available on the TOCPA site are the intellectual property of their authors and cannot be reproduced in any other media and used for any purposes without the prior permission in writing of the authors.