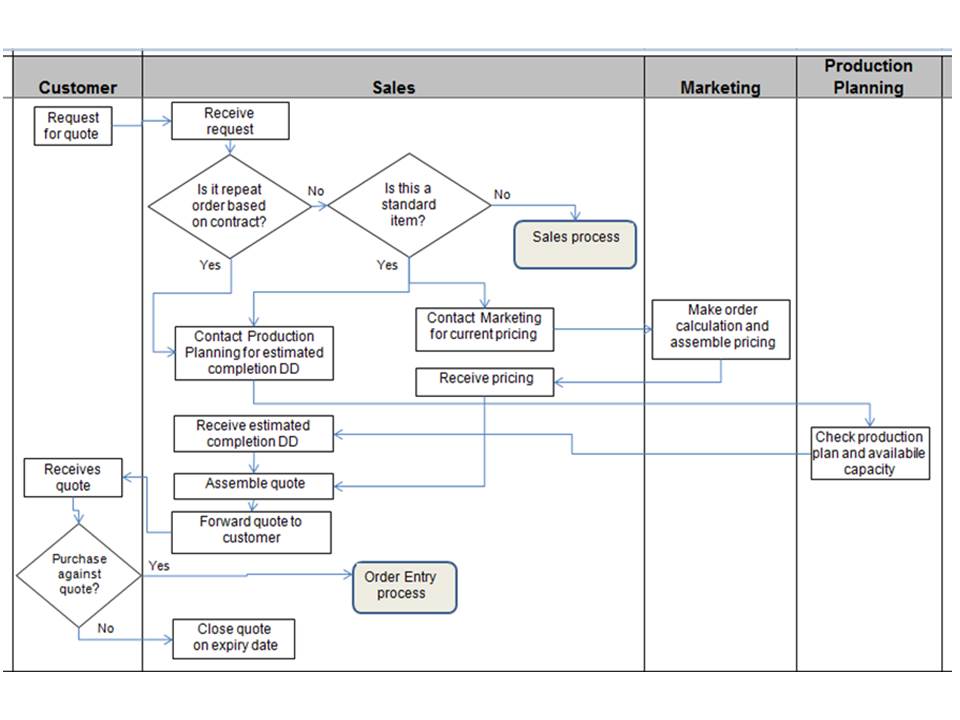
Deployment Chart
Deployment Chart is the best way to understand and record the way the system works. The deployment chart describes the entire flow of processes and interaction of the functions from receiving a Customer Order – from an external or internal customer – until shipping the finished goods.
The deployment chart provides us with the map to:
1. understand how the system works today – the sequence of processes and interaction of functions,
2. identify the areas for change, and
3. mark the places that the new procedures will be applied.
Source: Oded Cohen and Jelena Fedurko, Theory of Constraints Fundamentals, 2012
