Video and pdf materials from the 23d International TOCPA Conference in Tennessee, USA
19 presentations on TOC knowledge and applications from ten countries.
Read the participants feedback on the conference.
Latest
19 presentations on TOC knowledge and applications from ten countries.
Read the participants feedback on the conference.
 Gerald Kendall, TOC International, US
Gerald Kendall has five published books on TOC reflecting his successes in Project Management, Health Care, Viable Vision and Thinking Processes. He has implemented all elements of TOC with his worldwide clients over the past 22 years.
© Copyright Gerald I. Kendall 2006, 2016 All Rights Reserved
Introduction
“When I do an analysis of a company, I am satisfied only when I clearly see how it is possible to bring the company to have, in less than four years, net profit equal to its current total sales.”
This very ambitious goal, verbalized by Dr. Eli Goldratt [1], is so outside the norm of most company achievements, that many excellent managers laugh when they hear this quote. Sadly, many managers believe that anything even close to this level of improvement is impossible to achieve, especially in a large company.
Yet, in the majority of the hundreds of companies examined over the past three years, this belief was proven wrong—to the extent that many of these companies are now implementing their identified Viable Vision! They are succeeding in the pre-identified steps to turn their top line to bottom line within 4 years.
How is it even possible, let alone likely, that your company can achieve such rapid profit growth? The answer is in two facts:
For example, there are many companies whose salespeople focus on product content (features, quality, customization). Or, within many distributors of commodity products, we find most salespeople focus on aspects such as price, quantity discounts, minimum order quantities, geographic coverage. Some high technology providers see their competitive edge coming from a technical breakthrough.
In all of these companies, these tactics are NOT a decisive competitive edge. They may allow the company to exist and even to flourish for a limited time. However, these points typically do not provide a decisive competitive edge – one that will last for years and sustain a super high rate of growth.
In the Viable Vision approach, a decisive competitive edge implies that your company is meeting a client’s significant need to the extent that no important competitor can. The success is measured in year-after-year of high growth and having more prospects than the company can possibly address, even with internal capacity expanding at a high rate.
Here are a few examples – some of these will be discussed in more detail later in this article:
Viable Vision is unique in its approach, even within companies that are familiar with the Theory of Constraints (TOC) methodology. It is top-down. It is the focus of all top managers for 4 years or until the Viable Vision is achieved, whichever comes first. It begins with a significant, formal buy-in approach, using two forms of buy-in:
Buy-in usually begins with a healthy skepticism from many members of a senior management team. What makes senior management so skeptical? Their disbelief is usually based on the existence of huge obstacles that block a major improvement. It is possible to turn this skepticism around, but only if you can prove beyond a reasonable doubt that you can overcome these obstacles.
This article:
This is the dynamite needed to permanently break down the silos that are cemented in many of today’s management structures.
Two Ways to Manage – Traditional and Leveraged
Most executives currently deal with a very complex environment—one that is far more complex than it was 20 years ago. The Internet, for one thing, has exponentially increased competition and made business life uniquely challenging.
The common practice today, to manage this complexity, is to break down the organization into manageable parts (usually functional areas and departments), and to hold each part accountable for meeting goals within its silo. If you have any doubt about this, just look at your own organization chart and related metrics.
In this mode of management, we see executives spending considerable time to get their silos to cooperate with each other. Individual functional heads interpret what they think is best for their unit and assume it is best for the company as a whole. But often the best we can hope for, in this mode of management, is an attempt to minimize the cross-functional conflicts and damage. Executives become frustrated referees and jugglers, frequently overriding silo metrics in trying to do what makes sense for the organization as a whole.
One typical real-life example is the head of Procurement of a large Bangladesh company who claimed he was saving 70 million Taka (about US$1.3 million) per year by his department’s actions to reduce material costs. His staff spent an arduous year finding reliable and cheaper local suppliers to replace overseas vendors. These same actions were costing US $200,000 per week in lost Throughput, due to manufacturing problems created by substandard materials. The head of manufacturing and the procurement people fought constantly over whether or not the materials were the cause of the problem. The conflicts had become so common that they were just accepted as a fact of life.
We see similar conflicts in most organizations, for example, between Sales and Manufacturing or Sales and Marketing, or between Distributors and Suppliers within a supply chain, between Operations and Delivery personnel—especially in service organizations.
These conflicts are an inherent part of the traditional way of managing complexity. However, there is another way —the Viable Vision approach. This approach also accepts that organizations are a complex beast. To manage the complexity, Viable Vision finds the inherent simplicity (the biggest leverage point) in the midst of the complexity.
This approach assumes that an organization is like a chain. The strength of a chain is determined by its weakest link. Strengthening any link, other than the weakest link, does nothing to strengthen the chain. Therefore, finding the weakest link in the industry (including the Viable Vision company) becomes the leverage point for the organization’s resources. Strengthening it, with a comprehensive, cross-functional strategy and supporting tactics, is the way to ensure exponential growth.
Why the Traditional Approach Fails
With each functional head tasked with and measured on improving their area, they know they must achieve significant change within the quarter and the year to meet their goals. Such change fosters new projects, which each functional head sees as their absolute right to initiate.
Some projects require cross-functional resources. This is where huge conflicts often exist, since these same cross-functional resources (usually in Information Technology, sometimes in engineering or marketing) are in high demand by other functional areas.
The conflicts, however, are not just over resources. For example, if you are the Manufacturing VP, improvement means that you have made your area more efficient. Often, this translates into being able to produce more with the same resources. If you achieve this goal, but Sales is unable to sell your excess capacity, then the pressure is on you to lay off people—something that has many negative ramifications. This can lead to finger-pointing and other ill-feeling in the top management ranks.
There is another major reason why the traditional approach fails. Most companies have a vision, but unfortunately, many visions are not perceived by some key managers or employees as viable. The cross-functional logistics and steps needed to move closer to the vision are not in place. In this situation, each silo feels like it has no choice but to proceed, on its own, to local optima—i.e., to improving within the silo. But without the strongly managed connection (alignment) between silos, many local improvement efforts do not translate into significant bottom line results.
Viable Vision Backbone
Every Viable Vision strategy begins with the same starting assumptions:
Given these assumptions, the generic Viable Vision strategy has five key elements:
In each Viable Vision, we must identify a client’s significant need that will provide the opportunity to create a lasting, decisive, competitive edge. To be lasting, the competitive edge must never be based on price or cost. It must be in a form that no existing significant competitor can readily copy. In fact, for Viable Vision, we want the competitors to believe that the Viable Vision company is crazy to make such a ridiculous offer to their customers, and that they (the competitor) would certainly never match such an offer. That is one characteristic that makes the competitive edge “decisive”.
In the following examples, you will find detailed descriptions of two such Viable Visions.
Two Examples of Viable Visions
Example 1 – Reliable Rapid Response
In this example, there are certain conditions that must exist in the market in order for a company to gain a decisive competitive edge. These conditions include relatively long lead times (e.g., typically weeks, not hours or a day or two), poor due date performance by most suppliers (e.g., 80% or less – enough that the client cannot count on any delivery date promised), damages to the client as a result of late delivery (e.g., the client cannot manufacture their product, the client cannot unload a ship, the client cannot complete a building), clients do not have ready alternatives (e.g., if the product is highly customized, the client cannot go to a store and buy it), and the price they are paying for the product is small relative to what they are doing or building (e.g., the product is a $2,000 component of a $500,000 airplane).
It is not necessary for all of these conditions to exist in order for the market to be right. As long as clients suffer damage from supplier unreliability, and the product you are selling is a small part of the total value of the client’s end product or entity, there is a good chance that Reliable Rapid Response will work to achieve a Viable Vision.
With the above existing conditions, a company gains a decisive competitive edge when their prospects know that the company is remarkably reliable. Of course, there is an assumption that all other market-driven parameters (price, quality, lead time, range of offerings, etc.) are about the same as the competition.
A company can have a very high level of confidence in a supplier’s due date performance if the company is willing to back up the promise with a hefty penalty (e.g., 10% per day off the price for every day late – 10 days late and the product is free). Still, there are three main components needed to back up this offer:
Once these components are mastered, the company has met all the necessary conditions to begin offering much shorter lead times for a premium. Premiums can be anywhere from 10% to several hundred percent more than list price, depending on the extent of damage the client suffers from unreliability. For example, a precision machine shop in Colorado regularly gets three times their normal price when they deliver a custom part in 1 week instead of 4 weeks. A Canadian kitchen cabinet maker gets 50% more for the same custom kitchen delivered in 2 weeks rather than 6 weeks.
Every extra dollar goes right to the bottom line. Look at what happens to a company’s profits from this approach:
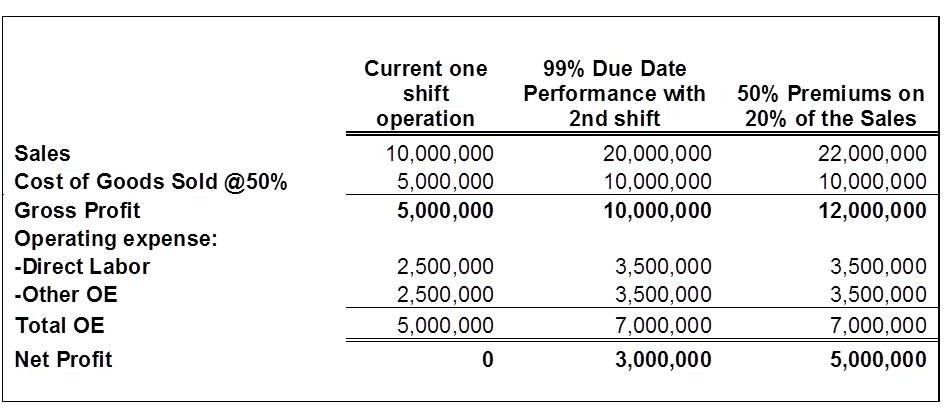
Figure 1
In Figure 1, in the first instance, the company is running one shift per day. From that, they are able to generate $10 million per year in sales. With a 50% cost of raw materials, they are left with half that much as Throughput or Gross Profit. Out of the gross profit, they must pay labor and all other operating expenses, leaving them at a break-even operation – zero profit.Figure 1 – Sales and Profit Impact of a Viable Vision
In the next column, we implement the first stage of a Viable Vision. With the implementation of production logistics, a company’s excess capacity is revealed. Experience has shown that there is often much more excess capacity than the company believes. When you take, as a first step, the rule of thumb of cutting production lead times in half, and releasing that much less to the shop floor, the effect is amazing. The shop floor’s excess work in process contracts significantly, and the excess capacity stands out. Therefore, the company is able to implement a full second shift without having to double either their direct labor or other operating expenses. From experience, the figures shown are generous.
That is why the net profit jumps from zero t o$3 million. But we are not finished. As sales becomes better and better, and the internal team is able to maintain protective capacity and grow resources as needed, we move to the last column, where we implement Viable Vision’s rapid response offer to the market. Before doing this, we must make sure that manufacturing can actually build a product in much shorter lead times, without having to expedite it through the plant. This is especially easy in most plants, which have production lead times far in excess of the actual touch times required to build a product.
In this stage, we are able to get premiums for much shorter lead times, as in the examples cited above. So on 20% of sales, or $4 million, we charge a 50% premium, securing another $2 million in revenues without incurring an additional cent in cost. As a result, our net profit for the same work as we did in the middle column, boosts our profit from $3 million to $5 million.
Once again, building the capabilities to take advantage of the reduced lead times implies significant marketing and sales work. The company must better define their target markets as those prospects who most benefit from their reliability offer. They must establish a pipeline of such prospects. The sales process steps must be defined in detail, and tools provided to the sales force to move quickly through those steps. The pipeline must then be monitored and constantly improved to shorten the sales cycle times and increase the success ratio.
Example 2 – Consumer Goods Distribution
Conditions that typify a consumer goods supply chain include low inventory turns, combined with frequent and numerous stock availability problems. Companies in the supply chain invest most of their available cash in inventory, but still suffer shortages. Suppliers typically make and stock products according to a sales forecast. Forecasts, especially involving end consumer behavior, are notoriously bad.
Distributors and retailers typically use a variation of a min/max inventory system to determine when to reorder stock. Both of these practices (supplying to a forecast and min/max system) contribute to major distortions in replenishment of goods throughout the supply chain. Resulting damage in lost sales, markdowns, obsolescence and lost customers are common.
With these practices in consumer goods markets, it is commonplace to see inventory turns of less than 6 per year, and turns of 2-3 per year are not unusual. TOC logistics changes the mode of replenishment from “push” to “pull”. This is done by linking all parts of the supply chain together to replenish what was actually consumed. Target inventories are adjusted automatically for any changes in consumer demand, or for known seasonality or other known aberrations.
Forecasts are still used at a consolidated level, for major manufacturing planning. However, actual consumption data is affecting the plant finished goods buffers and orders to the shop floor. The entire TOC replenishment system, from manufacturer to end consumer, is built to respond quickly to any changes in consumer demand. This puts the right inventory in the right place at the right time.
Today, many companies try to increase their turns by reducing inventory. The inventory turns can increase, but this can easily mask the bad way the results were achieved. If major markdowns were required to reduce the inventory or worse, major amounts of inventory were written off the ledger books, the turns number could improve, but the company still has poor cash flow and poor availability.
A decisive competitive edge in consumer goods distribution implies that margins are higher than with traditional approaches, turns are much higher, inventory levels are lower and availability across the supply chain has significantly improved.
But there is another common metric used by retailers with consumer goods products – Sales or gross profit per square meter/foot of shelf space. In TOC Consumer Goods Distribution, we call this Throughput per Shelf, or TPS for short. A supplier who has implemented the full replenishment solution can now move to the next stage of increasing their client’s TPS. One approach to do this is to prevent slow-moving products from staying on a given store’s shelf for too long. If the supplier has many more SKUs than they have actual products stocked in a given store, then they can easily substitute one set of SKUs for another.
In retail shops where slow movers are quickly removed and constantly replace with other items, consumers are encouraged to come back to the shop often to see what’s new. A retail chain can also check which products are selling well in comparable other regions or locations, and choose those items to substitute for the slow movers in another location.
When Viable Vision supplier trains their sales force correctly, they are able to sell business deals to clients, on the basis either of inventory turns or TPS, or first inventory turns moving to TPS as they get to know their clients better. Also, looking at the numbers, the supplier who increases TPS by 25% can demand some of that back in higher margins, and both parties will make a fortune. For an example, see figure 2 below.
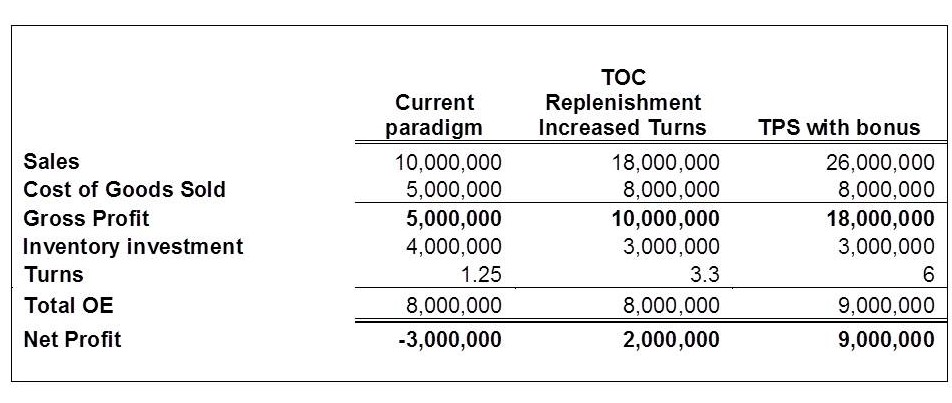
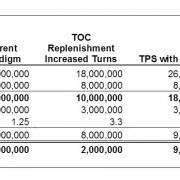
Figure 2 – TOC Replenishment and TPS Impact
In Figure 2, the current paradigm has the company generating sales of $10,000,000. With poor availability, the company will suffer from markdowns and obsolescence. Even though they have very lucrative average margins from suppliers (70% plus from overseas), they average 50% because of frequent markdowns. After paying all expenses, they are losing $3 million per year.
In the next column, we implement TOC replenishment solution. The company’s inventory goes down, availability goes up, and therefore sales rise dramatically. There are still some slow movers that the company is not addressing, so while margins improve from the previous scenario, they are still not achieving their full potential. However, turns more than double and now the company has a profit of $2 million.
But we are not finished. Viable Vision takes us to the next level using Throughput Per Shelf (TPS). In this paradigm, we are quickly exchanging slow movers. Sales improve dramatically. Inventory stays the same. We changed transportation logistics and so operating expenses increased. Yet we are left with almost double inventory turns again, and 4.5 times the net profit.
The consumer goods Viable Vision requires extensive sales training and practice. Salespeople must learn which prospects are suitable, and how to ask the right questions to find out. They must be able to do something totally foreign in retail – ask for higher margin for the same product, when the customer is selling more of the supplier’s goods.
Why would a retail customer be willing to pay a supplier more per unit, when they are selling more of the same product? If a retailer’s gross profit per square foot of shelf space doubles per time period, a 5% increase in price, even when they cannot pass that increase on to the consumer, still leaves them with a fortune. It still is much better than any competitive offering without TPS capability. However, it still must be professionally presented by a well trained business deal sales force.
These two examples provide a brief overview and a very small percentage of the current Viable Vision knowledge. Viable Vision implementations have been improved and simplified extensively over the past several years, to achieve results faster and faster with less strain on resources. It is a rapidly evolving, immense body of knowledge relative to how to accomplish major improvement in any size organization. The steps which are generally followed to identify and implement a Viable Vision are described next.
Five Steps to Viable Vision
Five steps are absolutely essential to identifying a Viable Vision and executing correctly. If any one step is missed or executed out of sequence, then the entire effort will be in jeopardy.
Step 1—Collect the data to identify the organization’s leverage point, and the Viable Vision needed to exploit it.
When the Viable Vision process first started, it was common to examine the flow of products and services through a supply chain, of which your company is one piece. A person analyzing the data would look for where is the flow blocked? What is the source of the blockage? How common is this in the industry? What damage is done to the customer, when this blockage occurs?
For example, if there is lots of inventory in the supply chain right through to the end consumer of the product, but there are still many items out of stock in any given location, then the leverage point is clearly with the TOC replenishment solution. The Viable Vision process will use the return on inventory to create a decisive competitive edge.
Some company salespeople bring many prospects to their door and then waste them—they don’t close the deal. Why not? In a Viable Vision, it would not be unusual to see close rates approaching greater than 50%.
In other cases, the company is tapped out of prospects in the markets they serve. They may have a high market share or they may not have achieved a competitive edge, even with a superior product. To reach a Viable Vision, that company may need to explore new markets, or create their own unique “Mafia Offer” – an offer that is too good to refuse for existing or new markets.
However, if creating such an offer requires new products to be developed, the company could suffer for a long period of time before tangible improvements are reached. A Viable Vision must do better than simply relying on new product development.
While over 70% of all companies are currently constrained by not having enough customers to buy their products, there are other possibilities. For example, a company may not be able to produce enough to meet the market demand. This may be a production logistics problem or a project management problem. Sometimes, even when the constraint is in the market, the correct answer to address the problem lies in changing manufacturing logistics to reduce lead time, improve reliability or for other reasons.
The constraint might be in the distribution channel, with suppliers or in engineering or even in sales. Regardless of where it is, the first step is to correctly identify the organization’s biggest leverage point.
Step 2—Gain the buy-in of the CEO to the Viable Vision
Viable Vision is a top down approach. What the CEO understands and supports gets done.
This critical dogma is not just a Viable Vision concept. It has been proven through research and empirical evidence and stated in the most popular management books—Good to Great, Execution, Six Sigma, Lean Thinking and many more.
In the Viable Vision process, one successful approach, that lends itself to further buy in from the top management team, is to draft a “straw man” Strategy and Tactics to achieve the Viable Vision. The draft Strategy and Tactics details, for each functional area, the required elements to achieve the Viable Vision. Usually, the CEO goes through a few iterations of the Strategy and Tactics document until he/she understands, agrees and is fully committed to supporting it. It makes no sense to move forward with the process unless the CEO fully understands how the Viable Vision will be accomplished, what the necessary strategy and tactics are, the assumptions behind the financial achievements and the strong desire to achieve the results. It is rare that a CEO has turned down such an opportunity. However, if a CEO has a different vision or is not prepared to make the Viable Vision Project THE MAIN PROJECT of the company for four years, the process will stop at this point.
It is important to note that even though the CEO has taken over ownership of the S&T at this point, his / her team has not. Therefore, it is a straw man S&T until the entire management team has scrutinized it, bought in and is committed to it.
Step 3—Gain the buy-in of the entire top management team
CEO buy-in is necessary, but not sufficient, to ensure the successful paradigm shifts for a Viable Vision. Therefore, the next step is to help the top management team understand why, for so long, their company was blocked from exponential growth.
Before all of the top managers can accept a Viable Vision solution, they must see a road map that makes sense. They must understand the systemic changes that they will take responsibility for implementing in manufacturing logistics, supply chain replenishment, project management, marketing and sales.
In the Viable Vision process, this step is accomplished in a one-day joint working session with the top management team, led by a Viable Vision expert. 100% top management team concurrence is necessary to proceed.
Step 4—Strategic Planning Kick-Off / Overview Education
Before building a strategy, all of top management must see the company through the same eyes. The current process follows a strategy and tactics road map, which has the following components to several levels of detail (most of the current templates are taken to four levels of detail):
For example, when working to identify target markets in consumer goods companies, we know how easily salespeople can get turned off by pursuing the wrong prospects. It is so easy for them to jump to the conclusion that this Viable Vision stuff just does not work. We also don’t want to waste their time with useless prospects. These assumptions explain why our strategy must be to have salespeople know which prospects are the best ones for the Inventory Turns offer.
To get to a valid tactic, we must know some details about our target market. For example, one assumption we will use is that the greater the number of SKUs, the more slow movers you tend to find, and therefore the more powerful the offer. Now it’s obvious that one of the characteristics we must look for in a target market is the right range of number of SKUs.
The process takes each block of the strategy and tactic structure and presents it to the company team. As the strategy and tactics are outlined in more and more detail, there will be a point where some of the detailed knowledge of the application (manufacturing, distribution, marketing, sales, project management) is conveyed to the group. With this knowledge, the group is able to define any reservations they may have about the solution (specific element of strategy or tactic).
Every reservation is gone over rigorously, either to prove that it is already taken care of in the strategy and tactic structure or it is noted as a point to consider during implementation. At the end of the process, which is best kept to no more than 2 days, the project plan is put together by assigning team members to each relevant piece of the structure at the most detailed level.
Step 5—Implementation
After a successful kick-off, Viable Vision becomes the company’s only major initiative. Every top manager is directly involved. Viable Visions use the TOC Project Management approach called Critical Chain. The project is actually planned to be achieved in 2.5 years. The remainder is a buffer. When the Viable Vision process is working correctly, significant results should be observable in weeks or at most, a few months.
Summary
In America today, executives are given about 20 months to prove themselves by delivering increased profits – bottom line results. In 57% of the companies surveyed in a three year period, CEOs failed to do so and were fired. What about in your country? It is just my humble opinion, but from my worldwide experiences, I see all countries having great challenges in technology, productivity and quality.
Many countries around the world are coming out of a long period where productivity was measured much more by internal country standards than by international standards. Yet to be successful and to enjoy real growth in personal wealth, you must be able to compete in business on the world playing field.
China, India, Vietnam, Korea and other emerging players are hot on everyone’s heels, not just in the cost of products, but in quality and design innovation as well. The Chinese have accomplished in 20 years what took the Americans and Japanese over 100 years to achieve. Malaysia and India are paying attention, and their economies are poised to boom over the next decade. The pressure is on your executives and managers to perform miracles.
Over the past three decades, most countries have had major improvements in schooling, especially in business. Business people have proven their ability to work hard and compete in the international arena. But the pressure of the advances in foreign competition took its toll. Today, hard work and low wages are simply not enough to win. Amazingly, the 9 countries I have worked in over the past 22 years [2] all take a similar approach, and bring comparable management skills to their work. What now is the key to drive a company to success?
My answer is that the key to success is the same one that is working equally well worldwide. Viable Vision is the logical extension of Dr. Edwards Deming’s work of the last century. Viable Vision brings the management team to identify and exploit its biggest leverage point for improvement. It focuses the now precious human resources on those key constraints of the business. It aligns the management team not just to work in harmony, but to work in the correct sequence on the right initiatives to achieve huge success. It overcomes one of the biggest constraints to any organization’s growth – the market – by identifying new and unique ways to bring major value your existing and your competitor’s customers.
Any country’s business management has a great, but limited history of achieving results. At the same time, every country has major obstacles to overcome. Viable Vision is, I believe, the missing ingredient to drive new, high growth and secure the future.
[1] Goldratt is the founder of the Theory of Constraints (TOC), author of the multi-million bestselling book, The Goal and several others, including Critical Chain, Necessary But Not Sufficient, It’s Not Luck, The Haystack Syndrome and The Theory of Constraints.
[2] Malaysia, Bangladesh, Australia, Switzerland, Italy, Canada, Poland, Germany and United States


The 24th TOCPA Conference and Master Classes are conducted on 31 March – 1 April 2016, in Bogota, Colomboa, together with Piensalo Colombia.

We have just completed the 23d International TOCPA Conference in Tennessee, US.
We have started posting comments and photos. The conference material will be published within a few weeks.
 John Muncaster, Goldratt UK
John is an experienced TOC and Lean practitioner who, with more than 25 years of experience, has occupied several positions in manufacturing companies in the UK.
Agile is a software development philosophy that is best summed up in the Agile Manifesto (http://www.Agilemanifesto.org/):
There is an assumption in the Agile world that, in software, when starting development there is no need to fully understand the specification of the end product. In many cases this may be continually evolving. The Agile world also assumes that what is being delivered can be broken down into smaller chunks. These chunks provide useful functionality and can be released as soon as they are tested. This works particularly well when developing software for Web services. It is very common when visiting a favourite website to see some of the pages transformed into a new version, whilst others remain in the current format. Over time all pages will be transformed to the new style as the software to support these pages is developed and tested.
In Agile the intent is to simplify by breaking a big project into small chunks, with a clear definition of done, and build autonomous teams to deliver the chunk. The team should be self-sufficient and self-managing. The team retains focus by further breaking down the chunk into short duration discreet tasks. These tasks are distributed amongst the team for delivery. Cadence is maintained by the team keeping WIP low and regularly reporting progress. This reporting of progress ensures that team members are focused on delivering what they have committed to. This allows the power of the team to become engaged when any task becomes stuck.
Organisations have built processes to support these Agile philosophies and this document does not intend to define them, rate them, or discuss them in detail. It is enough to say they all have merits, supporters and documentary evidence to show they work. Some follow all the guiding principles of Agile well and others focus on a smaller subset.
In environments where the software itself is the end product, and the product is expected to continuously evolve, Agile has an excellent track record. The question raised here is, can this flexible approach work in an environment where the software is integral to a physical product that is being developed? Can the true, flexible, Agile approach that offers so much in continuously evolving software products be as useful for delivery of a full set of functionality to a deadline? Particularly when, the software supports the hard launch of a physical product. For example; all car drivers want all of the software to be working and fully tested when they buy their new vehicle. It is not possible to launch a vehicle requiring a future upgrade to make the braking system work effectively all the time.
However, as with all things, it is important not to throw away valuable principles and techniques just because the full philosophy is not applicable in some circumstances. This document will identify how core elements of Agile can be used seamlessly with the successful deadline focused project management tool – Critical Chain.
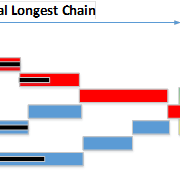
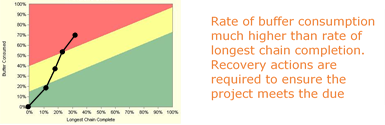
Critical chain is a Gantt based project management tool that uses the rate of consumption of a protective buffer compared with the rate of completion of the longest chain of tasks to understand the health of the project.
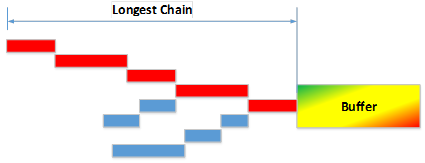
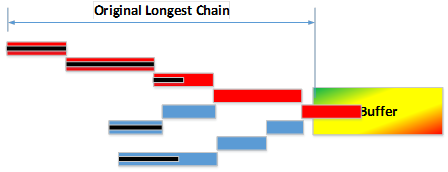
As tasks are completed the remaining duration of the tasks are likely to extend and buffer is consumed.
Progress is measured by comparing the percentage of longest chain complete to the amount of buffer consumed.
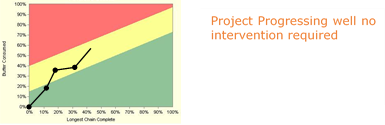
If, this metric demonstrates good health, the project team can be left alone to continue the good work. If, it demonstrates that the health is poor and therefore the delivery date is in jeopardy, it highlights to the team and management that action is required to bring it back on track.
When building traditional Gantt charts, there is a temptation to focus on creating plans with infinite detail, and to micromanage resources with the plan. Assigning the role of building the project solely to the project manager is common, as is developing detailed plans for projects of months or even years. This approach is in direct conflict with the principles laid out in the Agile manifesto. This approach is also in conflict with good critical chain plans which are:
It is clear that building a good Critical Chain plan has no conflict with the Agile Manifesto. It should be noted that some of the process developed by organisations, consulting bodies and academics to support the Agile community may in themselves conflict with Critical Chain planning. Using the core principles of Agile will definitely assist in developing a good Critical Chain plan ready for Execution. Truly Agile organisations will be prepared to flex the tools being employed to support their principles if this gives them an advantage.
In execution of traditionally built project plans, it is common that focus remains on items that were deemed critical or time limiting at the start of a project, even if in execution this proves not to be the case. There is also a temptation to follow the old adage “the sooner we start the sooner we will finish” and work is released to individuals and teams faster than they can complete it. This causes significant problems with priority setting and losses due to multitasking and context switching. Good Critical chain execution focuses on:
In most project environments there is a high level of uncertainty in the tasks being carried out. With any tool being deployed there is a reasonable chance that what has been agreed with the customer in terms of cost, scope and delivery date will require modification. Critical Chain is no different and successful Critical Chain implementations require good channels of communication between the project team and the customer to obtain the optimal outcome for the customer.
There are no direct conflicts between Agile and Critical Chain and the two philosophies can be used quite comfortably with each other. In fact, if project teams building Critical Chain projects have the Agile manifesto in mind, they will certainly develop much better quality project plans. There are some direct conflicts between some of the tools developed for applying the two philosophies. In many cases this can be resolved by the organisation ensuring they have selected the right tools for their environment. Projects delivering software as a service will need a slightly different set of tools than those delivering physical product with a software element.
All materials available on the TOCPA site are the intellectual property of their authors and cannot be reproduced in any other media and used for any purposes without the prior permission in writing of the authors.
A long-standing TOC colleague offered a riddle to solve:
Situation: A factory has many projects to do. Some are the industrialization of new products that they can be produced effectively.
Some are improvement projects for speed, capacity, quality, cost reduction, capacity expansions.
For the moment assume that the factory/company decides correctly which product development projects should be pursued (for instance with the 6 technology questions, AND improvement projects are also selected correctly with proper application of T, I, OE and proper focus on the organization’s constraint.
There is still a big difficulty … conflict!

The 23rd TOCPA Conference is conducted on 21-22 March 2016, Dollywood’s Dream More Resort, Pigeon Forge, Tennessee, by TOCPA together with TOC International as a special event of get together of long-standing TOC colleagues and friends.
The registration is handled by Gerald Kendall of TOC International gerryikendall@cs.com
Over 15 presentations in two days will look into important issues of TOC knowledge, implementations and developments in the areas of:
The conference is conducted in a beautiful area of Smoky Mountains at Dollywood Dream More Resort In Pigeon Forge, Tennessee.

Recently, we have had discussions with some TOC practitioners that expressed some frustration about the progress of their implementations. They claimed that while the first part of the TOC project produced outstanding results within a few months, the continuation of the growth was not as rapid and not as easy as they have expected it to be.

You can see the videos and pdf of the presentateions from the 21st TOCPA Conference here
We are continuing to publish a new book Theory of Constrains in Practice from the TOC Strategic Solutions Library. It is a collection of cases and articles by TOC experts and practitioners from all around the world sharing their knowledge and experience gained in TOC implementations.
This chapter belongs to a collection of vintage articles written by leading TOC practitioners. It was first published in 2010.
Stratton et al., 2010. Applying Manufacturing Flow Theory to Construction Management. Proceedings of the Interantional European Operations Management Association Conference Porto, Portugal.
The authors:

Dr. Roy Stratton is Associate Professor on Operations and Supply chain Management at Nottingham Trent University in the UK. His research into managing flow in complex environments extends across healthcare and construction environments. He runs an MSc in Theory of Constraints.
Nottingham Trent University, Nottingham, NG1 4BU, UK
 Professor Lauri Koskela is Professor of Construction and Project Management at the University of Huddersfield in England. He is a founding member of the International Group for Lean Construction, and has contributed to the theory of Lean Construction.
The University of Salford, Salford, M5 4WT, UK
 Dr. Abdullah Alsehaimi is a head of civil engineering department, college of engineering in Yanbu, Taibah University, Saudi Arabia. He is also the general supervisor of the medical city projects – a teaching hospital (400 bed) and medical colleges which all under construction.
A.O.Alsehaimi@pgr.salford.ac.uk
The University of Salford, Salford, M5 4WT, UK
Anssi Koskenvesa is a Finnish entrepreneur, trainer and researcher in the field of construction production and production planning. He has been involved in Lean Construction since 1993 and a founding member of the International Group for Lean Construction.
Tampere University of Technology, Tampere, Finland
Abstract
Both lean and Theory of Constraints (TOC) applications are now commonly reporting success in the application of flow concepts to construction management, namely, lean construction and Critical Chain Project Management (CCPM). Both approaches are concerned with improved flow through synchronization and reduced waste, but the means by which this is achieved are distinctly different. This paper reports on the conceptual similarities and distinctions of CCPM and lean construction based on secondary sources together with separate case and action research studies previously published by the authors.
Keywords: Critical Chain, Lean Construction, Last Planner
Introduction
Theory in operations management has undergone significant change in the past 40 years with a shift from an economic cost-based view to one emphasizing flow and the drive to continually eliminate waste and manage variability. The emphasis on variation and waste reduction are most notably associated with Deming (1982), Ohno (1988) and Womack et al. (1990) and now the term Lean. Whereas the strategic management of variation and uncertainty emerged with Skinner (1974), Hill (1985) and more recently Goldratt (1990) and Hopp and Spearman (2000) who more explicitly use the concept of variability buffering.
This shift in manufacturing thinking has not been so evident within the largely separate operations field of project management, where the underlying theoretical basis for project planning and control remains largely cost focused and has not significantly changed in over 50 years. For example, it has been long acknowledged that the planning and control tools, such as network planning and scheduling, do not effectively supported project management generally, and construction management in particular, with Fondahl’s (1980) experience remaining common today.
‘All too often, however, only the original plan and scheduling data are ever produced. They continue to cover the office wall long after they are obsolete and bear little resemblance to the current progress of the job.’
(Fondahl, 1980).
This paper attempts to bring together two independent developments in project/construction management that address this issue by translating manufacturing flow concepts into the field of construction management, namely Lean Construction (LC) and Critical Chain Project Management (CCPM).
Specific questions to be addressed in this paper are:
In addressing these questions the authors have drawn on both secondary sources and their primary case and action research knowledge of such implementations (AlSehaimi et al., 2009; Koskenvesa and Koskela, 2005; Stratton, 2009).
How and why do the conceptual approaches work?
The main features of LP and CCPM are outlined below with a theoretical explanation.
Last Planner
The Last Planner system (LPS) was developed piecemeal, in response to the discovery of additional functions needed in order to manage the problem of work flow variability. This can be classified as follows: Ballard (2000)
Moreover the important role of the Last Planner tool is to replace optimistic planning with realistic planning by evaluating the performance of workers based on their ability to reliably achieve their commitments.
The concept of the Last Planner System has five main integrated elements (Ballard and Howell, 2003; Mossman, 2007), namely, master planning, phase planning, look ahead planning, weekly work planning and percent plan complete.
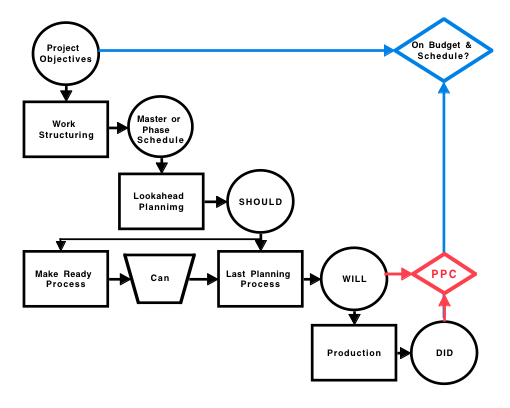
Figure 1 The Last Planner System (LCI, 2001)
In the Last Planner System the sequences of implementation of the above mentioned elements set up an efficient planning framework through a pull technique. This is summarized in Figure 1 as Should, Can, Will and Did which are the key terms in the weekly work plan (Ballard, 2000). Should reflects the preferred priority, Can what is possible now given availability, Will the commitment and Did what was achieved and reported by percentage planned completed (PPC). Traditional practices do not consider a difference between what Should, Can, and Will be done, the assumption being that pushing more tasks will result in better results. The general idea is that in order to obtain an even workflow, a weekly work planning and a careful monitoring of the plan performance is needed. This takes place through the weekly plan, prepared on site and as close as possible to the week in question. The weekly plan defines what Will be done and PPC tells what Did get done.
Critical Chain Project Management
A central driver for adopting CCPM is enabling more predictable and shorter project lead times. The argument is that this not only will enhance time-related order-winning criteria but will also reduce cost and improve adherence to specification. The main conceptual elements and distinctive features of CCPM relate to planning, execution and improvement as detailed below (Goldratt, 2007).
Project planning
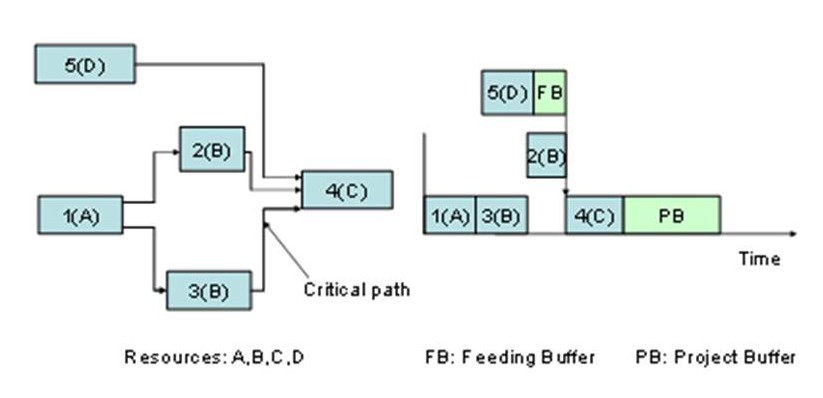
Figure 2 Network diagram (left) and critical chain schedule showing buffers (right) (Stratton, 2009)
Project execution and continuous improvement
It is common practice for activity times to be reported in terms of work done, an economic measure that is often only formally reported weekly or even monthly. With CCPM the remaining time to complete the activity is reported on a much more frequent basis – ideally daily.
As there are no intermediate task dates in the planning system the task-time-remaining data provides advanced notice of upcoming tasks (this has previously been referred to as a resource buffer).
In the more complex multi-project environment, there are many in-progress tasks competing for a resource provider’s time. In CCPM they are prioritised in terms of the ratio of critical chain completion and buffer consumption, commonly using green, yellow and red priority colour codes. Upcoming tasks are also displayed, indicating their relative priority as well as the projected time when these tasks are expected to become available to that resource.
Consumption of the buffer indicates a task is exceeding the ambitious time and that the task manager may need assistance. Action at the project level may be needed to recover a situation.
At this level, the priority status of all projects is reviewed periodically to monitor and address higher level programme recovery.
The relevant reasons for delay are extracted to focus improvement activity.
The planning and execution steps form the core of the CCPM approach but are not sufficient on their own. Pre planning steps involve reducing the number of live projects and ensuring that pre kitting is complete before a project is allowed to start.
What evidence is there to support the claims?
Objective support for the value of these two approaches can be both empirical and theoretical, as reported below.
Last Planner
The reported benefits, for all parties involved in construction projects, deriving from the implementation of Last Planner go beyond the initial theoretically justified benefits. These empirically observed benefits include: improved planning efficiency and reliability, improved productivity, improved plan reliability, more accurate prediction of resources, reduced uncertainty, preparation of team members to be in collaboration, enhanced learning process by continuous assessment, improved work quality and safety, and thereby reduced duration and cost of projects, promotion of other development work such as risk management, and facilitated implementation of organisational change and continuous improvement. These benefits are evident in many case studies reports and research papers across several countries (Ballard, 1994; Ballard and Howell, 2003; Kim and Jang (2005); Koskenvesa and Koskela, 2005; Mossman, 2007; Alsehaimi et al., 2009; Ballard and Howell, 1997; Koskenvesa and Koskela, 2005; Fiallo and Revelo, 2002; Ballard, 1999; Ballard et al., 1996; Junior et al., 1998; Thomassen et al., 2003).
Critical Chain Project Management
Case and survey research into the application of CCPM are still very limited. However, one measure of the level of interest in CCPM is the availability of CCPM-capable project management software. There is a growing range of software systems claiming to be CCPM-capable ranging upward in price from $250.
Realization the suppliers of the Concerto CCPM software has published customers’ case studies which include ABB, Delta, Boeing, US Marine Core Base, Lucent Technologies, Hewlett Packard and US Air Force Warner Robins Air Logistics Centre (Concerto Case Studies, 2010). Realisation has also been closely involved in the development of Goldratt’s (2007) Strategy & Tactic implementation guide, and the software is closely aligned with it. Using the Realisation Website (Concerto case studies, 2010) data, typical benefits include: reduced lead time by 25%; delivery performance increased to 90+%; and increased throughput by 20% with the same resource. Of these few have been formally published with one prominent exception, Warner Robins Air Logistics Centre (Srinivasan et al., 2007), where they implemented CCPM to reduce repair turnaround time on C-5 Galaxy transport aircraft.
In the construction sector, Stratton (2009) reported case research into a pilot implementation of CCPM using the strategy and tactics advocated by Goldartt (2007) in a multi project environment. This implementation was shown to follow the prescribed guidance with significant improvements in delivery performance and cost across 4 projects.
The use of CCPM on public works programmes in Japan since 2004 (Kishira & Ohara, 2005) has recently been expanded nationally through the Japanese government public works programme (Stratton, 2009) with reductions in duration averaging 20% and cost 7%.
CCPM has also been reviewed critically from a theoretical standpoint and the issues raised may be classified as follows.
Summary
Both LP and CCPM have been used productively over many years by practitioners but the nature of the environment makes the gathering of empirical research evidence difficult. CCPM has drawn more academic interest because of its broader application to project management and clear challenge to established project management practice and underlying theory. In both cases the value of the approach is supported by theoretical argument.
How and why do these approaches theoretically relate?
The review of LP and CCPM has clarified how these distinct approaches can be related to both reducing and managing variation and uncertainty. As with lean and TOC manufacturing, LP emphasizes waste reduction and CCPM the management of variability and uncertainty. It is, however, interesting to note how CCPM was a natural extension of DBR as both use time buffers. Whereas, LP represents a more radical departure form lean manufacturing. This may be explained by considering the strategic needs across the operations spectrum from project to line and the respective emphasis of managing and reducing variability. This might explain why LP elements could not be readily transferred from lean manufacturing whereas CCPM is more of a natural extension of DBR.
Planning
A clear distinction in these two approaches is the planning scope between Last Planner and CCPM. As the name suggests LP looks ahead up to 6 weeks to indentify what Should be done and ‘made ready’ but the main focus is on the detailed day to day planning over one to two weeks where what Should be done is reconciled with what Can be done (Fig 1) in establishing commitments about what Will be done. The LP system does not significantly contribute to longer term planning, giving little guidance on how to structure the master and phased plans.
CCPM conversely, encompasses the overall project plan, but does not address the day to day detailed planning. It is interesting to note that the S&T guide (Goldratt, 2007: 5,13,1) stresses the importance of the task activities not being too small (ie greater than 2% of the project lead time). This is to facilitate the control process and acknowledges the need to devolve the detailed planning to local decision making.
CCPM now embraces multiple project planning and the ongoing development of the approach is clearly evident in that a virtual drum is now advocated as a basis for staggering projects (Goldratt, 2007:15,13,3).
Execution
A key measure in LP is the percentage planned activities completed and this is
dependent on reducing uncertainty and coordinating activities in completing what is agreed on a weekly basis. Where the Should activity cannot be completed, a less critical substitute activity is prepared to ensure the resource is not idle.
In CCPM the control focus is on the ratio of consumption of the project buffer to completion of the critical chain and, therefore, the emphasis is on timely completion, hence prioritizing the Should over the Can activities. Although there is no formalized weekly planning meeting as in LP, the expectation is that projected activity completion dates are reported on a daily basis, although twice a week is possibly more realistic (Stratton, 2009). This, therefore, informs all involved of the status, as well as the priority of different activites, together with the significance of any delay. This status is then used to expedite activities or escalate additional resource requirements as required.
Improvement
LP as with lean is geared towards reducing waste and the associated uncertainty. A key feature of the weekly meetings is collecting information on the reasons for not achieving planned completions and targeting improvement. Although this was not originally part of CCPM this capability has recently been incorporated in some CCPM software and is key feature of the CCPM guide.
What are the wider implications for construction and project management?
Both systems address the need to plan and control in a highly uncertain environment:
This paper has helped clarify that the lean and TOC philosophies compliment each other and need to be reflected in any flow management systems. It is clear that both LP and CCPM have evolved to encompass common elements as in the case of CCPM embracing ‘make ready’ and targeted improvement. Although these approaches have been used in construction management for many years there development appears to be largely independent and the authors there is much potential in exploring their integration.
Although flow theory is clearly applicable to construction management more structured research is needed to verify these benefits and practically integrate the associated management and reduction of variation and uncertainty.
Conclusion
Generally, the starting point of development has a dominant impact on the initial nature and scope of the two approaches: Last Planner and Critical Chain. The LP method was developed in a design science research manner, to alleviate the practical problems of construction teams (Koskela and Ballard, 2006), whereas CCPM originated from an attempt to rectify shortcomings in the Critical Path Method, extending the TOC manufacturing application of time buffering. Traditional project management, as in the Critical Path Method (CPM), is based on a transformation concept of production. In this concept, the basic unit of analysis, the task, is atemporal and mutually independent except precedence relationships. The CPM procedure then finds the best order and timing of these tasks. Both CCPM and LP subscribe to flow conceptualization, which addresses how work actually flows, in time, through different stages of the project. However, these two methods pick up different foci in flow: CC operates through aggregated buffers, whereas LP endeavours to reduce the cause of buffers: variability. It is clear some of these distinctions have already diluted as the approaches have evolved in the same direction.
References
Alsehaimi A., Tzortzopoulos P. and Koskela L. (2009). “Last Planner System: Experiences from Pilot implementation in the Middle East”, Proceedings of the 17th IGLC conference, Taipei, Taiwan, July.
Ballard, G. (1994), “The Last Planner”. Spring Conference of the Northern California Construction Institute, Monterey, CA, April 1994.
Ballard, G. and Howell, G. (1998). “Shielding Production: Essential Step in Production Control”, Journal of Construction Engineering and Management, Vol. 124, No1, pp. 11-17.
Ballard, G. (2000). “The Last Planner System of production control”, PhD thesis, University of Birmingham, Birmingham, UK.
Ballard, G., and Howell, G. (2003). “An update on Last Planner.” Proceedings of 11th IGLC Conference, Blacksburg, VA.
Ballard, G., Tommelein, L., Koskela, L. and Howell, G., 2002. “Lean Construction Tools and Techniques”, in Best, R., and De Valence, G (Eds): Design and Construction: Building in Value. Butterworth-Heinemann, Oxford, pp. 227-255.
Concerto case studies (http://www.realization.com/) (accessed 24th March 10)
Deming, W.E., 1982. Quality, Productivity and Competitive Position. Cambridge, MA: MIT Press.
Elton, J., Roe, J., 1998. “Bringing Discipline to Project Management”. Harvard Business Review, March-April, pp. 53-159.
Fiallo, C. and Revelo, V. (2002). “Applying LPS to a Construction Project: A Case Study in Quito, Equador”, Proceedings of the 10th IGLC Conference, Gramado, Brazil.
Fondahl, J., 1980. “Network Techniques for Project Planning, Scheduling and Control”, in: Frein, J. (Ed.), Handbook of Construction Management and Organisation, Van Nostrand Reinhold, NY, pp. 442-471.
Goldratt, E.M. (1990), The Haystack Syndrome: sifting information from a sea of data. North River Press, Cronton-on-Hudson, NY.
Goldratt, E.M., 1997. Critical Chain. North River Press, MA.
Goldratt, E.M., 2007. Viewer Notebook: The Goldratt Webcast Program on Project Management – the strategy and tactics tree for projects 4.7.1. Goldratt Group Publication.
Herroelen, W. and Leus, R. 2001. “On the merits and pitfalls of critical chain scheduling”, Journal of Operations Management, Vol. 19, pp. 559-577.
Hill, T., 1985. Manufacturing Strategy. London: Macmillan Education.
Hopp W.J., and Spearman, M.L., 2000. Factory Physics. 2nd Ed., Singapore: McGraw Hill.
Howell, G. (1999). “What is Lean Construction-1999”, Proceedings of 6th IGLC Conference, California, Berkeley, 26-28 July.
Junior, A., Scola, A., and Conte, A. (1998). “Last Planner as a Site Operations Tool”, Proceedings of the 6th IGLC Conference, Guaruja, Sao Paulo, Brazil.
Kim Y. and Jang J. (2005), “Case study: An application of Last Planner to heavy civil construction in Korea”, Proceedings of 13th IGLC conference, Sydney, Australia, July 2005.
Kishira, Y., and Ohara, S., 2005. “Implementation of P2M for Public Construction and Analysis of the Results”. Proceedings of PM FORUM, July/August.
Kostella, L and Ballard, G., 2006. “Should project management be based on theories of economics or production?” Building Research and Information , Vol. 34, No. 2, pp. 154-163.
Koskenvesa, A. and Koskela, L. (2005). “Introducing Last Planner: Finnish Experiences”, Proceedings do the CIB Symposium, Helsinki, Finland.
Leach, L.P., 1999. “Critical Chain Project Management Improves Project Performance”, Project Management Journal, June, pp. 39-51.
Lechler, T.G., Ronen, B., Stohr, E.A., 2005. “Critical Chain: A new project management paradigm or old wine in new bottles?”, Engineering Management Journal, Vol. 17, No.4, pp. 45-58.
LCI, 2001. Lean construction institute. http://www.leanconstruction.org/
Mossman A. (2007), An Introduction to Lean Construction and Last Planner, workshop manual, available at (http://www.leanconstruction.org/) (accessed 25th March 10)
Newbold, R.C., (1998). Project Management in the Fast Lane – applying the theory of constraints. St Lucie Press.
Ohno, T., (1988). The Toyota Production System; Beyond Large-Scale Production. Productivity Press, Portland, Origan.
Raz, T., Barnes, R., Dvir, D. (2003) “A Critical Look at Critical Chain Project Management”. Project Management Journal. Dec, pp. 24-32.
Skinner, W., (1974), “The Focused Factory”, Harvard Business Review, May-June, pp113-21.
Srinivasan, M.M., Best, W.D., and Chandrasekaran, S., (2007), “Warner Robins Air Logistics Centre Streamlines Aircraft Repair and Overhaul” Interfaces, Vol. 37, No. 1, pp. 7-21.
Steyn, H., (2000), “An Investigation into the Fundamentals of Critical Chain Project Scheduling”, International Journal of Project Management, Vol. 19, pp. 363-369.
Stratton, R., (2009). “Critical Chain Project Management – Theory and Practice”. Journal of Project Management and Systems Engineering, TOC Special Issue, Vol 4, pp. 149-173.
Thomassen, M., Sander, D., Barnes, K., and Nielsen, A. (2003), “Experience and results from implementing lean construction in a Large Danish contracting firm”, Proceedings of the 13th IGLC Conference, Virginia, USA.
Trietsch, D., (2005), “Why a Critical Path by Any Other Name Would Smell Less Sweet?” Project Management Journal, 36(1), 27-36.
Womack, J.P., Jones, D.T, and Roos, D., (1990), The Machine that Changed the World, Macmillan, NY.
All materials available on the TOCPA site are the intellectual property of their authors and cannot be reproduced in any other media and used for any purposes without the prior permission in writing of the authors.